

Slant’s dashboards are powerful tools that allow clients to access real consumer spending data across multiple retail categories, so you can track the weekly performance of your own brands and those of your competitors.
Want to see how it works? We created an example of our standard dashboard that tracks actual spending at popular coffee chains. We analysed more than 200,000 transactions to see where people get their caffeine fix, how much they spend, and which brands are outperforming.
Note that the screen grabs below represent this week’s dashboard view. The dashboard updates every Monday, so the numbers might shift slightly by the time you read this. But that’s the benefit of real-time data, right?
How much do people spend on coffee?
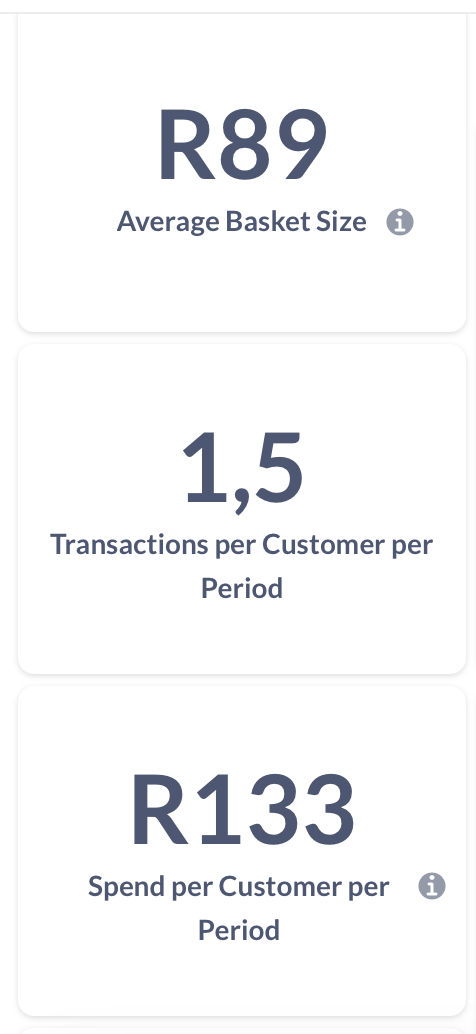
Let’s consider the largest coffee chains: Vida, Starbucks, Seattle, Bootlegger, Platō… The average consumer at these stores spends about R90 per visit. Everyone in the dataset must have shopped at least once to be included, so the average transaction frequency of 1.5 times per week implies that 50% of all customers transact at least twice per week for a total spend of R133 on average.
Spending habits change depending on income:
- High-income earners (R30k+ pm) spend slightly more and buy coffee more often, resulting in an average spend of R146 per week.
- Lower-income earners (R5k–R15k pm) spend R11 less per visit and buy coffee less often. Despite Vida holding the highest market share across all income brackets, this lower-income segment also loves Starbucks.Starbucks captures about 25% of this demographic’s coffee spend, whereas across all demographics Starbucks only accounts for 15% of total coffee spend.
Which of the big chain stores is winning?
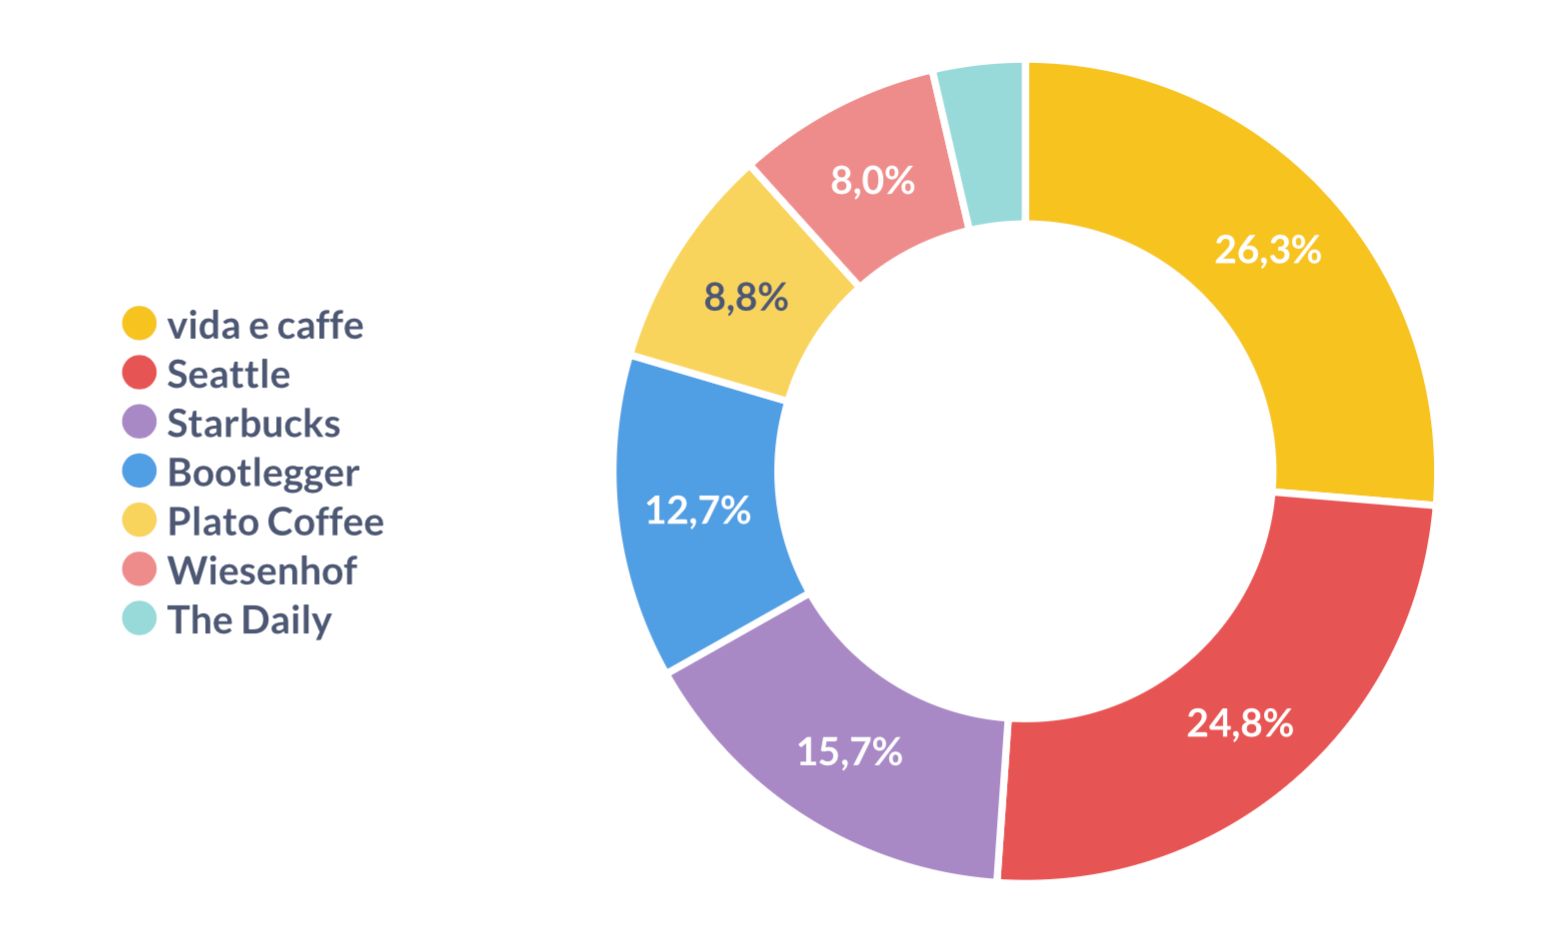
Across all income groups, Vida e Caffé leads with 26% market share, followed closely by Seattle at 25%, Starbucks at 15,7% and Bootlegger at 12.7%. These four chains make up 70–80% of spending in all income segments.
The holiday effect: Starbucks’ secret weapon
Every December, Starbucks sees a market-share spike, repeating a pattern from previous years. The reason? Limited-edition festive drinks! Unfortunately, this doesn’t translate into longer-term spend. In fact, Starbucks seems to be losing out as Bootlegger and Plato keep growing.

So, what’s driving market share?
Market dominance isn’t just about store count, it’s a function of how many customers choose a brand, how often they visit and how much they spend per visit.
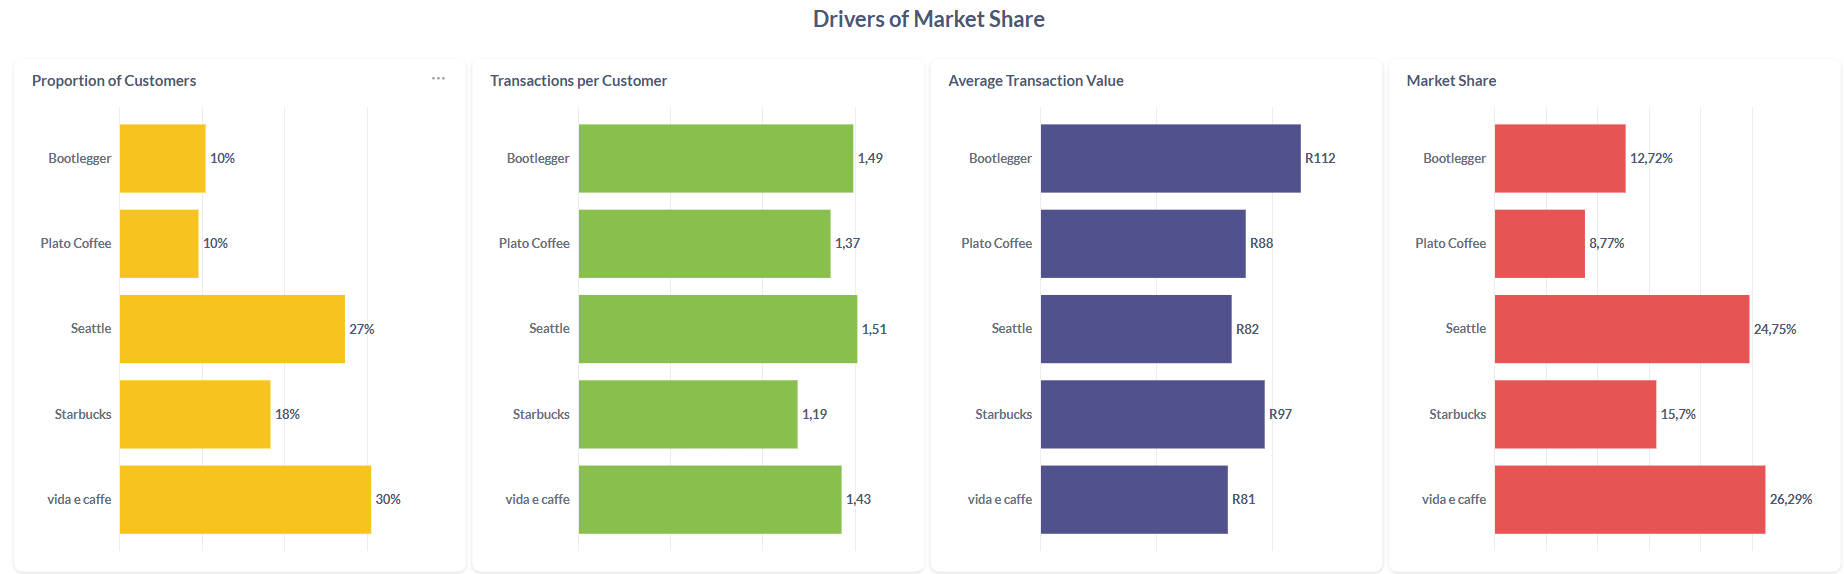
For example, Bootlegger and Platō attract the same number of customers, but Bootlegger has a stronger market share because the average spend in store is higher (R112 vs R88 per visit). Similarly, Vida and Seattle are neck-and-neck when it comes to number of visits and spend per visit. It’s Vida’s greater number of customers giving them the edge.
What’s ATV got to do with it?
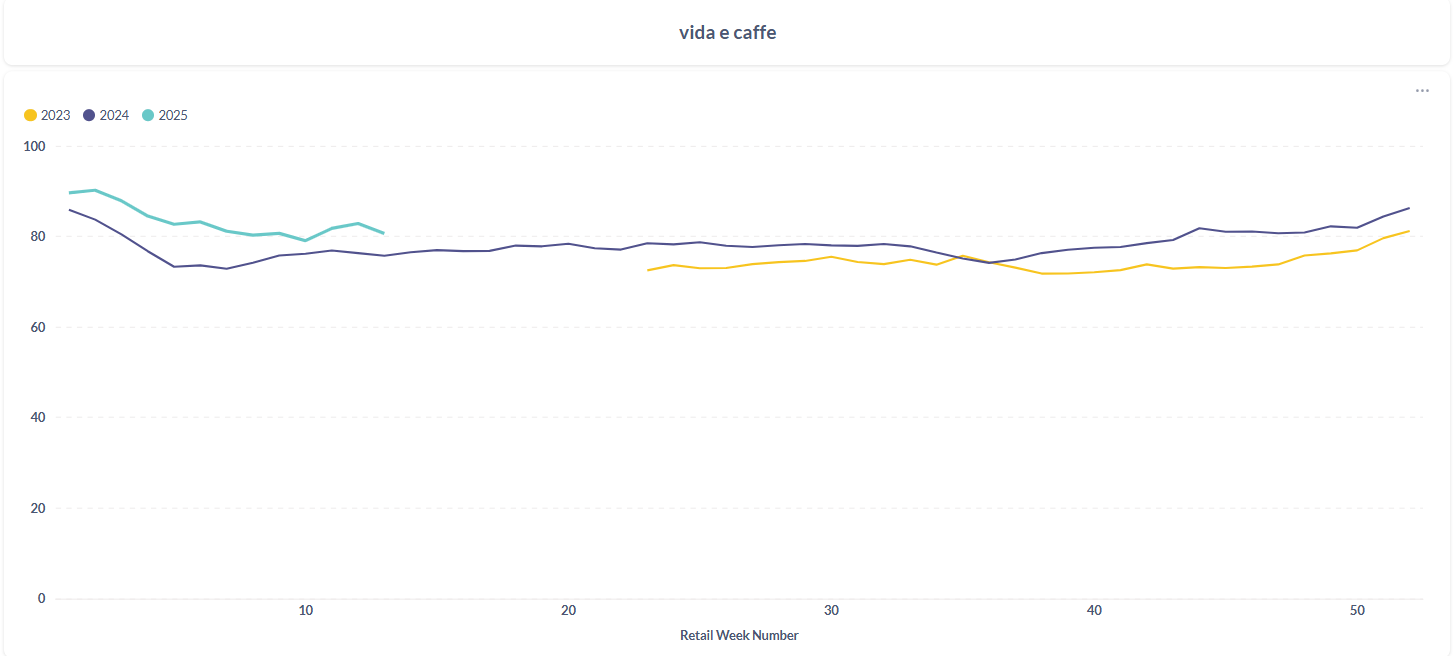
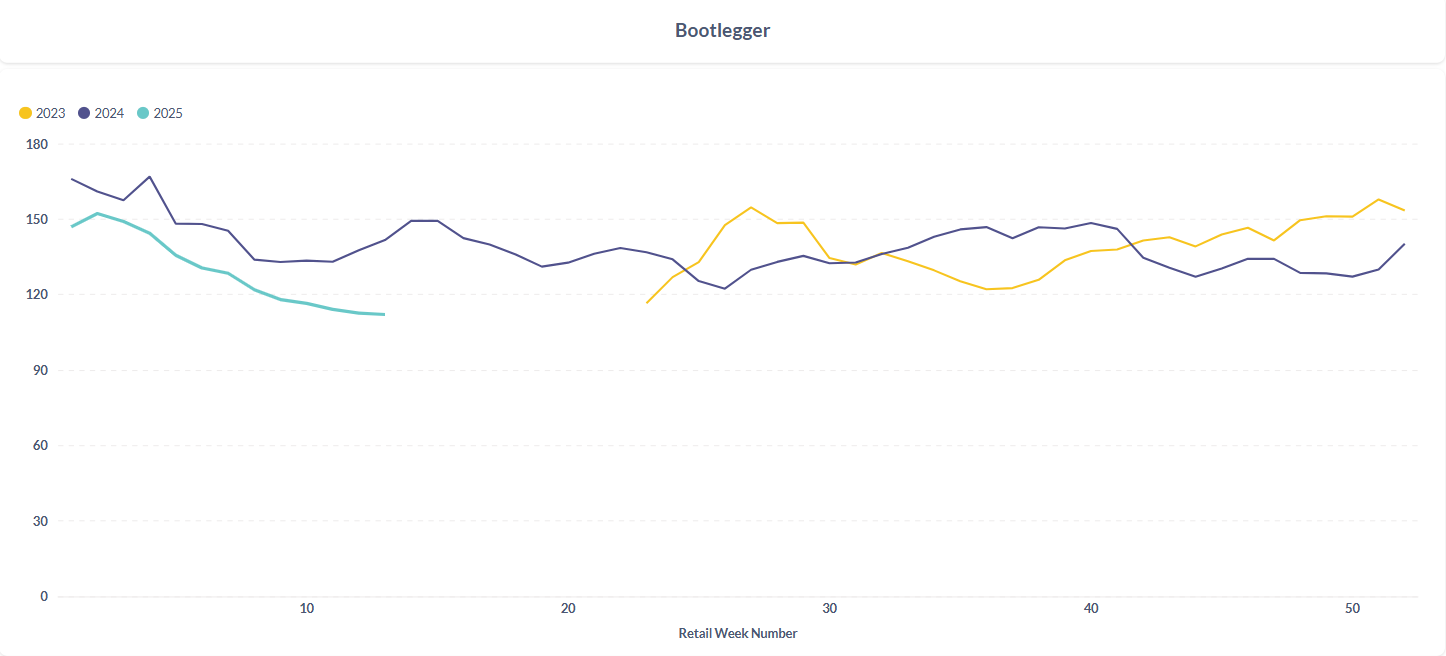
Let’s compare average transaction value (ATV) – comparing brands to previous performance and to the performance of competitors. Vida’s ATV has been higher for all weeks in 2025 compared to the same period in 2024, which explains part of their market-share uptick. Bootlegger, on the other hand, has seen a dip in year-on-year ATV. This doesn’t seem to have had a detrimental effect, however, as their market share is still growing.
Will Vida keep its lead?
In 2023 and 2024, Vida e Caffé and Seattle were close competitors. In early 2025, however, Vida is growing faster than ever while Seattle remains steady. If this trend holds, Vida could extend its lead even further – unless Seattle makes a move…
Does our market share analysis align with what you expected? Or are you surprised by Bootlegger and Platō’s growth?
This analysis shows how alternative data can reveal insights beyond the obvious. Have a look at our trial dashboard and explore the data for yourself.
Want insights like this for your industry?
Our dashboards don’t just track coffee – we provide real-time spending data for Grocery, Apparel, General Merchandise and more.