

The Eating Out sector is one of the most dynamic spending categories that we track. To make sense of the market, we’ve divided it into the following segments: Burgers (McDonalds, Burger King etc), Chicken (KFC, Chicken Licken etc), Seafood (Ocean Basket, Fishaways etc), Pizza (Panarotti’s, Romans etc.) and Steakhouse (Spur, The Hussar Grill etc).
While the category is constantly evolving, one segment is dominating. Since mid-2023, Chicken brands have been constantly gaining ground, with a market share increase of 5%.
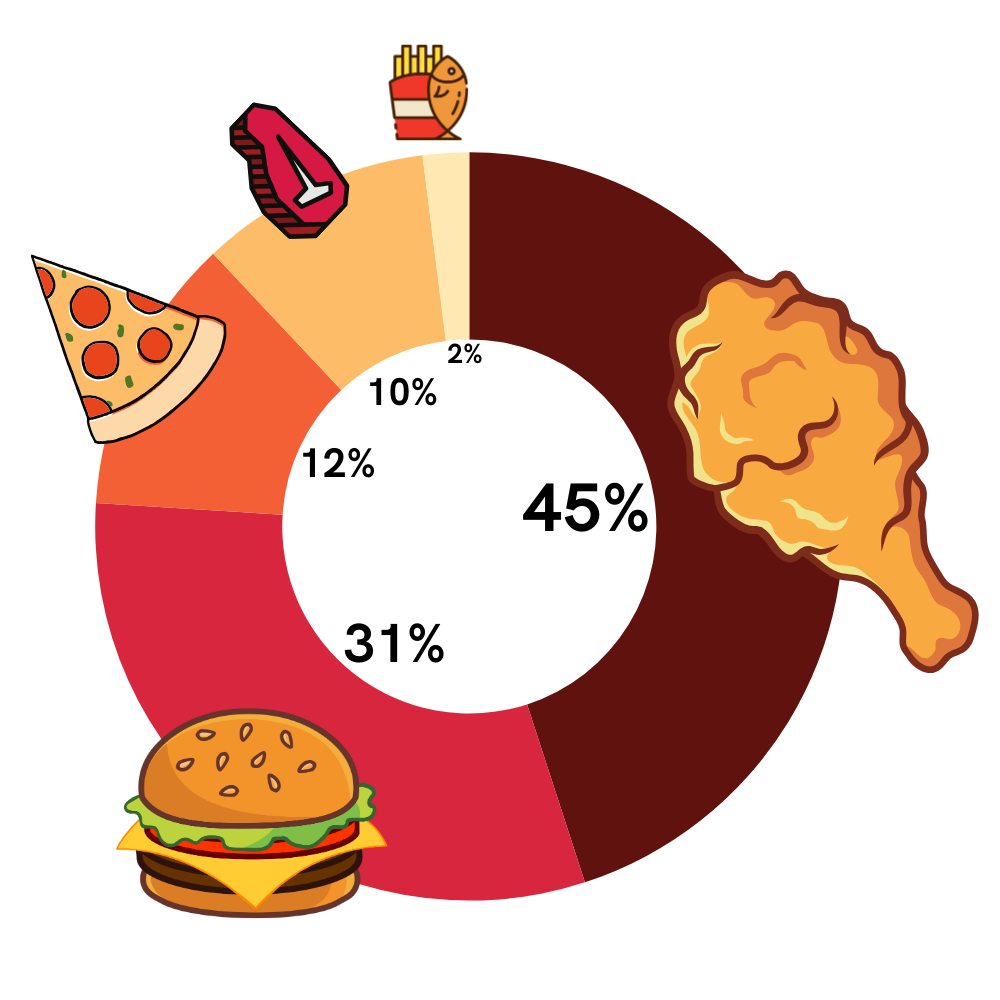
Eating Out: 2025 Market Share
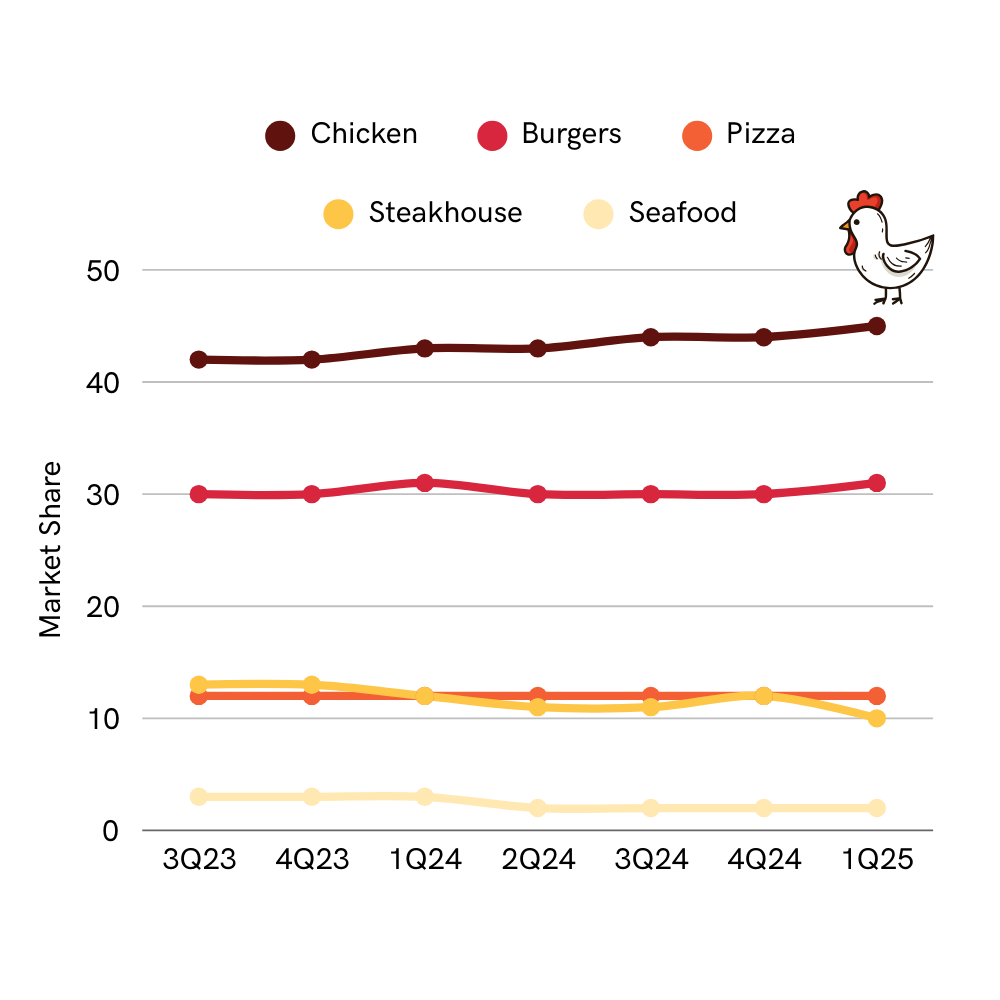
Chicken power
Slant is uniquely positioned to evaluate how customers engage with brands. In any given month, we can calculate a brand’s market share by looking at the number of customers who buy from that brand, the frequency of their purchases and the average transaction value each time.
When the market share formula is applied to the Eating Out category, it’s clear that Chicken’s dominance is not driven by transaction value, it’s driven by volume. Despite having the lowest average transaction value of all the segments, chicken brands attract the highest number of customers. Nearly half of all fast food customers choose a chicken brand, and three out of ten order chicken twice a week.
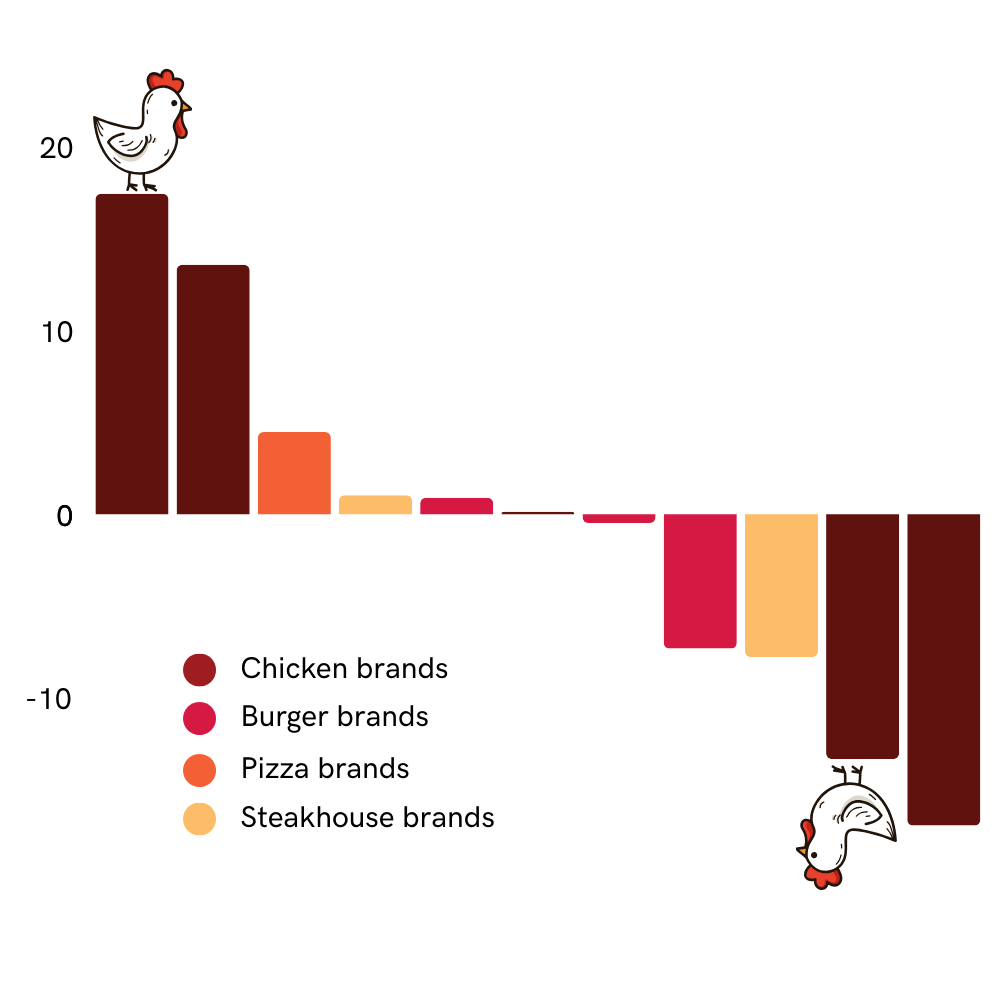
Does that mean every chicken brand in the segment is having a clucking good time? Unfortunately not. Growth is not universal, and while certain brands are winning, others are losing out.
Growth in market share (%)
First six weeks of 2025 vs 2024
Want to know which chicken brands are outperforming? Or which have lost market share? Or maybe you’re more into pizza… The Slant Dashboards give you real-time consumer spending data across multiple retail categories so you can track the performance of your own brands and those of your competitors. Click below for a limited free trial.