
While the Apparel category has always been an amalgamation of clothing and footwear, some sub-categories of footwear have seen rapid growth over recent years. Today, there are more opportunities than ever before to buy designer branded takkies. Canal Walk, for example, lists 27 of their 112 apparel stores in the ‘Sneakers’ sub-category? The proportion is likely to be similar at other malls around the country.
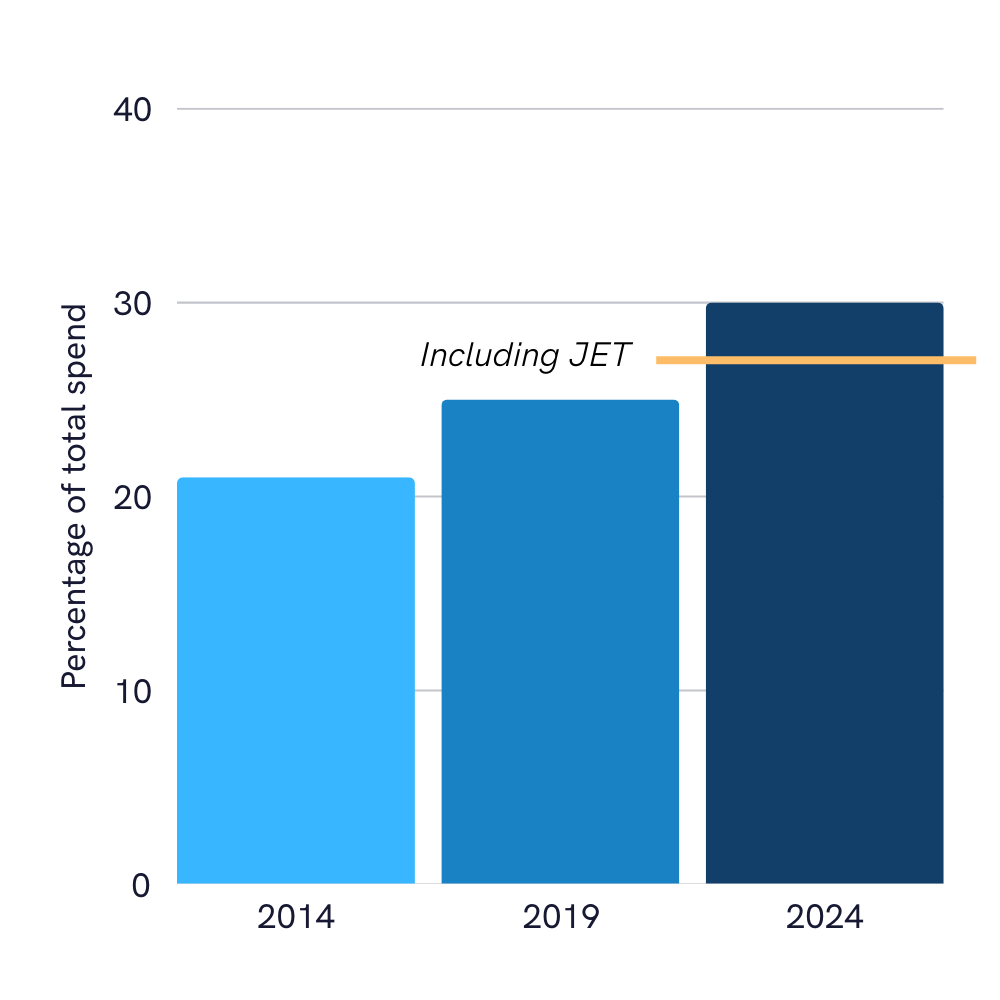
The retailer that has arguably benefitted the most from this uptick is TFG Africa. From 2019 to 2024, they grew the number of footwear-focused stores in their stable at 9.2% per annum – double the growth rate across their total store base (4.6% total growth, excluding acquired JET stores; 7.4% including JET). As of March 2024, footwear brands like sportscene, Totalsports, Sneaker Factory and others accounted for 30% of all TFG stores (excluding JET) – up from 25% in 2019. When the company reports is latest numbers in a few weeks’ time, that proportion will almost certainly be higher.
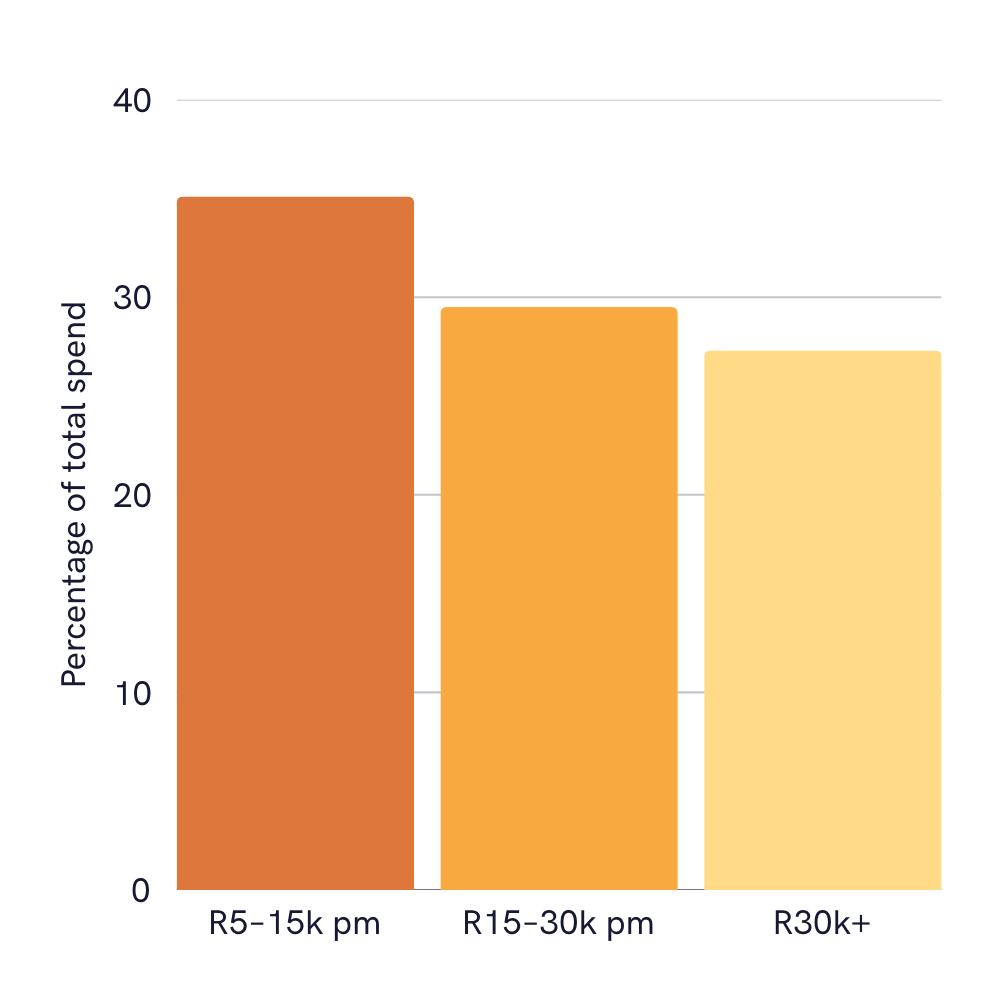
If we look at spending share, the sneaker effect is even more pronounced. By our estimate, footwear-focused brands make up nearly a third of all spending across TFG’s portfolio. The contribution by these brands is higher in lower income brackets.
Contribution by TFG footwear brands to total spend (excluding JET)
TFG footwear revenue by income bracket
30% of total spending is high. When we compare TFG to the other national apparel retailers, the next-highest generates around 10% of total spend from footwear-focussed brands.
Yes, we know that some TFG’s footwear brands – especially sportscene and Totalsports – have matured into formats that sell much more than just shoes. However, the clothing items and accessories sold in these stores are also usually branded. In other words, they’re goods that share many of the same characteristics as branded footwear: lower margins and longer working capital cycles compared to in-house brands, for example.
We estimate that TFG’s organic growth over the past five years (~14% pa) has significantly outpaced its peer group (~6%). Could the faster growth of footwear store numbers, compounded by footwear’s higher average transaction values, explain this outperformance?
But something else is happening. Recent evidence in our data suggest that TFG’s dominance in this category is being tested by competitor brands – and the competition is affecting growth.
Has the footwear advantage run its course for TFG?
You need to be logged in to read further.
If you are a client, please reset your password and login using your corporate e-mail address.
Slant offers solutions for investors, corporates and data partners. Click the button below to get in touch and find out how our alternative data and class-leading research can help you.