

When it comes to demographics, a ‘healthy’ country shows as a pyramid: a wide base representing a large number of young people, which becomes incrementally narrower through the age groups.
South Africa’s chart is a bit different – it’s pyramid-shaped from the age of 45 and up, but below that it’s more of a rectangle. Put another way, it means the average South African is getting older, not younger. The average age is currently 31.5; in a decade it will be 33.2.
The structure of a country’s population is a key driving force of any economy and, in the field of predicting the future, demographics is one of the few ‘certainties’. The implications of this are significant, mainly because you can’t escape demographic trends: it’s unlikely that we’ll have more 30-year-olds in 2035, with all their extra buying power, if there are fewer 20-year-olds today.
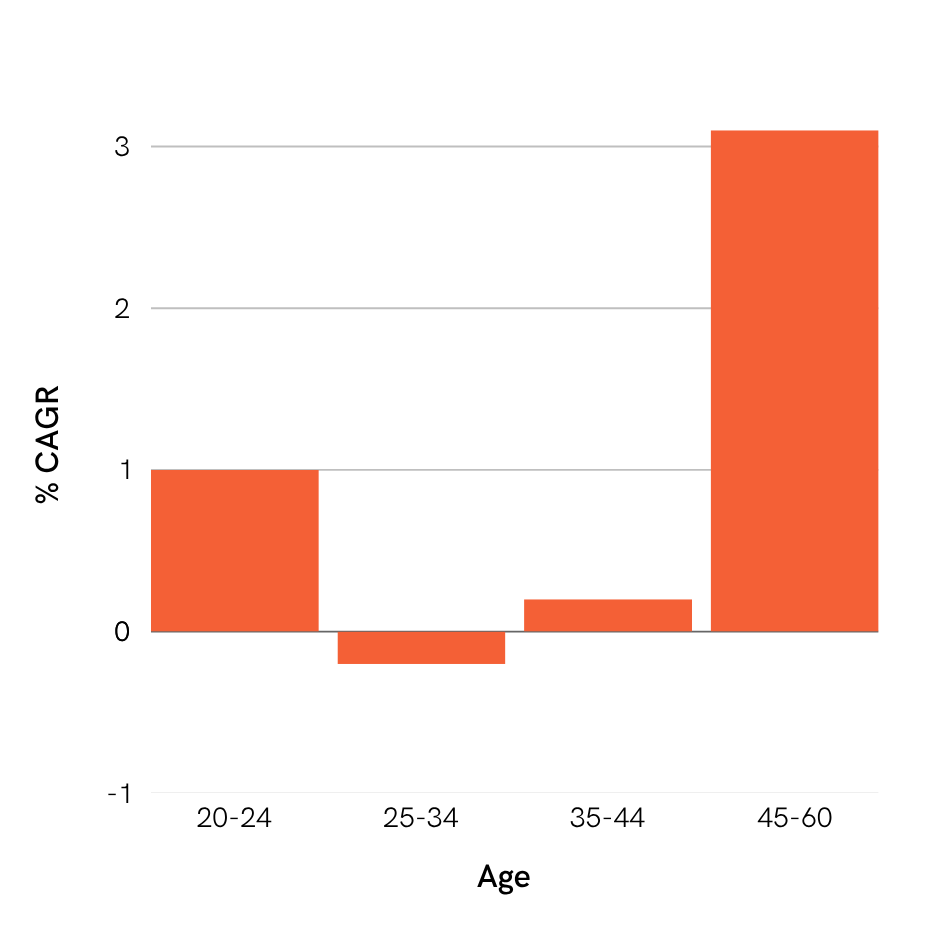
In the chart below, you can see how South Africa’s ageing population affects the growth rate in different age brackets. Over the next decade, for example, the number of 21-year-olds is expected to increase by only 1% pa. In contrast, over the same period, the number of cash-flush 30-year-olds is forecast to shrink. Age groups forecast to grow are nearly all older than 40. For example, in a decade, the number of 54-year-olds is expected to be 50% larger than it is today.
10-year growth rates by population sub-group
Obstacle or opportunity?
The needs of a consumer change as they get older, so an ageing population is not necessarily a bad thing for all companies. Diverging growth rates in various age brackets translate into opportunities for different categories of consumption.
Take those 54-year-olds; I’ll be one of them in 10 years’ time. I predict a spike in cover versions of 1990s hits and an increased demand for e-bikes… But that’s anecdotal. What do the numbers say?
Slant has a unique view of consumer spending across the age spectrum, which allows us to quantify demographic trends and highlight outliers and unexpected deviations.
The chart below shows the average age of customers who transact in each of the consumer categories that we track, relative to the average customer in the sample of ~250,000 bank statements the data is extracted from.
Average age by consumer category
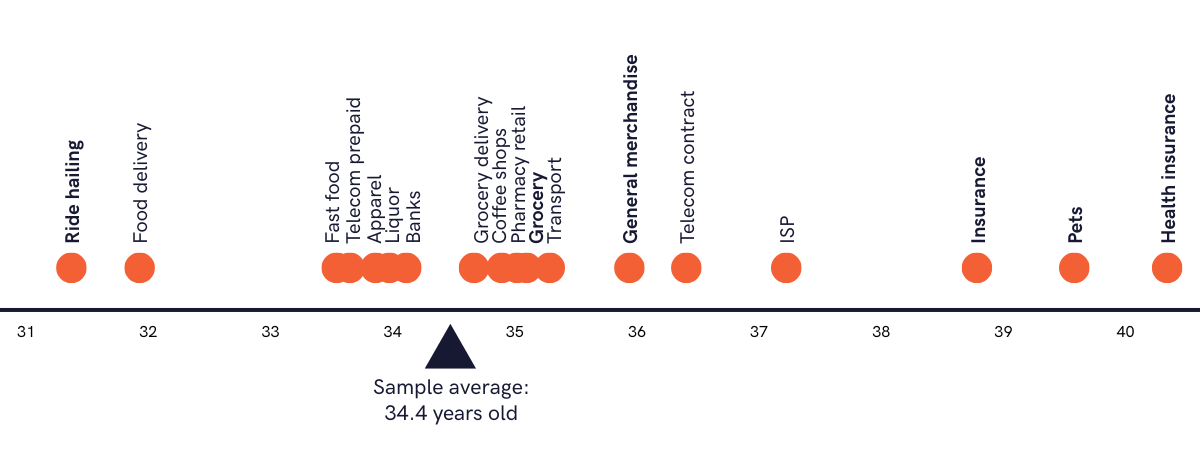
Insurance customers, on average, are older than customers who use ride-hailing services like Uber. Unsurprisingly, customers who buy groceries are fairly representative of the sample average. General merchandise customers are slightly older than the average, and apparel customers are slightly younger.
Given South Africa’s ageing population, and all else being equal, logic suggests that demand for categories on the right will increase faster than categories on the left. For example, the number of customers looking to sign up for a mobile contract will likely increase faster than the number of customers opting for prepaid.
This also explains why the grocery retailers are scrambling to win the pet-food war. Short of establishing relatively complex insurance divisions, the Pets category is likely to be important for their current customers in the future, and a source of sales growth.
But things are not equal.
The first thing to note is that existing demand for some categories is skewed. This is the case where technology has caused disruption – in such instances, demand is likely to be more representative of a younger, digital-savvy, early-adopting population group. Ride hailing and food delivery apps are good examples of this: it’s no surprise that they have the youngest customers. Aggregate demand for these services will continue to grow as usage becomes more representative of the greater population.
The second issue to consider is that per-person spending varies across age groups. Take groceries, which nearly everyone buys. Our data shows that grocery spending increases consistently with age. As you get older, your income generally increases and your household size increases, so it’s reasonable that spending also increases – nearly 20% per incremental age bracket in our data.
It’s helpful to quantify this trend and identify patterns across the various spending categories. See the chart below: Health Insurance predictably shows the highest average increase in spending across age brackets. Increase in spending at the retailers in our General Merchandise category also shows a healthy upward trend. (As we get older, does ‘entertainment’ becomes home maintenance and gardening?)
Average increase in spending by age and retail category
(18–25 bracket indexed to 100)
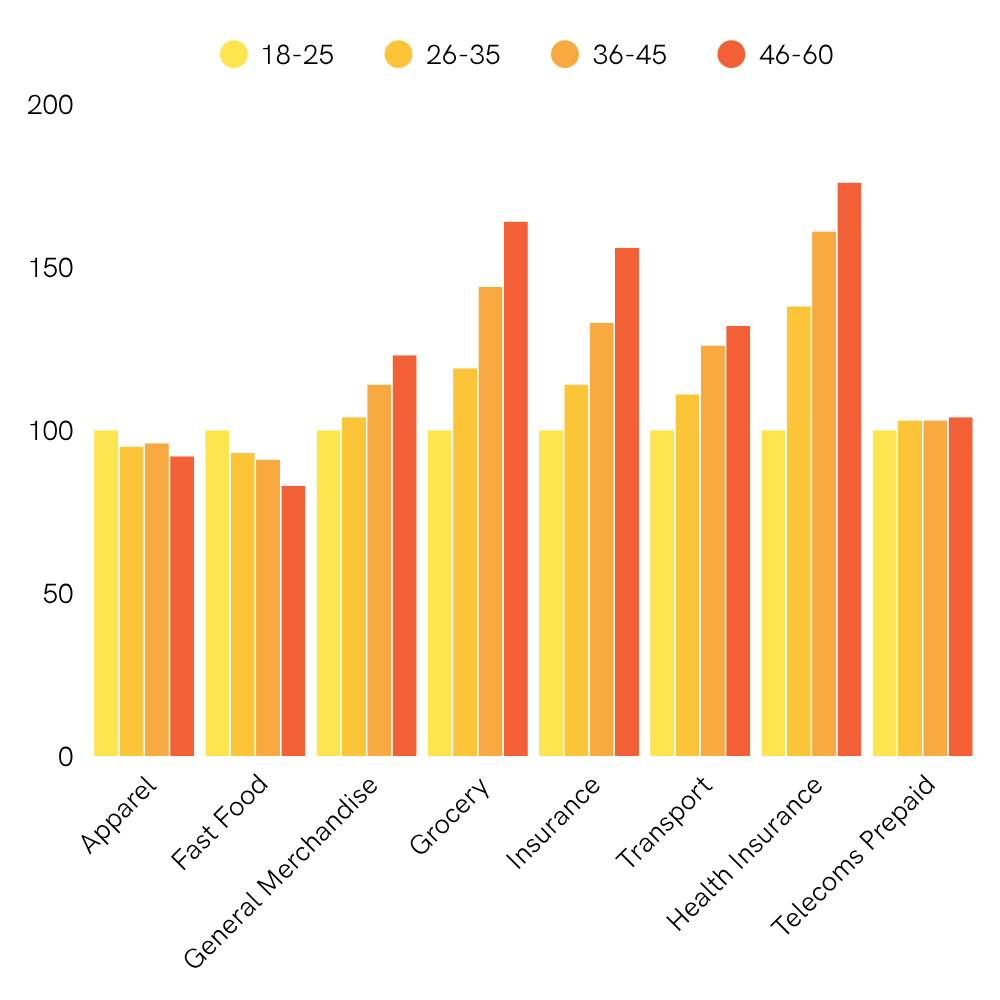
It’s worth noting how stable spending is in the Telecoms Prepaid category. Maybe this is a topic for another report? Luckily for the mobile operators, there are so many consumers in SA lining up to get a sixth sim-card…
Spending in the Fast Food category declines as customers age. Is there a point in life where buckets of deep-fried chicken are traded for air-fried fillets at home?
But the most significant trend in the data, given the investable exposure to listed retailers, is the declining spend in the Apparel category as customers age. Let’s go there.
Young and independent vs old with dependents
In contrast to most other consumer spending categories, where average spending per customer increases with age, spending in the Apparel category declines. In our data, 18-25 year-olds are the most valuable target market for apparel retailers. Typically, in a ‘healthy’ population, successively larger cohorts of consumers may compensate for the trend of declining spend by age, which propels industry growth irrespectively. However, an ageing population is a serious headwind for growth, especially when the spending trends among consumers is downward with age.
As always, a ‘negative’ trend doesn’t affect all retailers equally. Some retailers will benefit and others will lose out. When we segment the data and consider the age of the average customer by brand, we can better understand which brands – and which parent companies – are most exposed to the demographic headwind described above.
You need to be logged in to read further.
If you are a client, please reset your password and login using your corporate e-mail address.
Slant offers solutions for investors, corporates and data partners. Click the button below to get in touch and find out how our alternative data and class-leading research can help you.