
A retailer’s performance is often evaluated based on market share. But market share, like portfolio alpha, is vulnerable to poor benchmark selection. In this note, we argue that the widely accepted definition of South Africa’s grocery ‘market’ omits key retailers, especially fast-growing, online, general retailers like Temu. Because of this omission, even standout grocery brands like Checkers Sixty60 are probably overstating their relative performance.
We also make the case for a far more useful metric than traditional market share: Slant’s Share of Customer Spend. It’s a measure of how relevant a brand is to that brand’s actual customers – not a measure of the brand’s relevance to all potential customers – and therefore more accurate when gauging performance versus competitors.
Using Share of Customer Spend, and our expanded market definition, we found that:
- Shoprite attracts the highest spending share from its customers. Spar and Sixty60 also attract above-average share.
- Woolworths, Boxer and Checkers in-store attract below-average spending share.
- Customers of all listed grocery retailers, across all income brackets, have shifted significant spending share to GM retailers like Temu.
- The rise in popularity of retailers like Temu presents an inflation-adjusted headwind of ~7% for the listed grocery retailers.
- Although all retailers are likely to be affected by this, Checkers is the most defensive because of Sixty60 (notwithstanding evidence that Sixty60 customers also have a high adoption of other online brands); and Shoprite is most at risk because of the high spending share rates at GM retailers among its customers.
Benchmark shopping
Every money manager knows how important a benchmark is. It defines relative performance and has the potential to diminish or inflate performance.
Similarly, in retail, performance is evaluated in terms of market share: the relative performance of one retailer against a collection of competitors that sell similar products or serve similar customers.
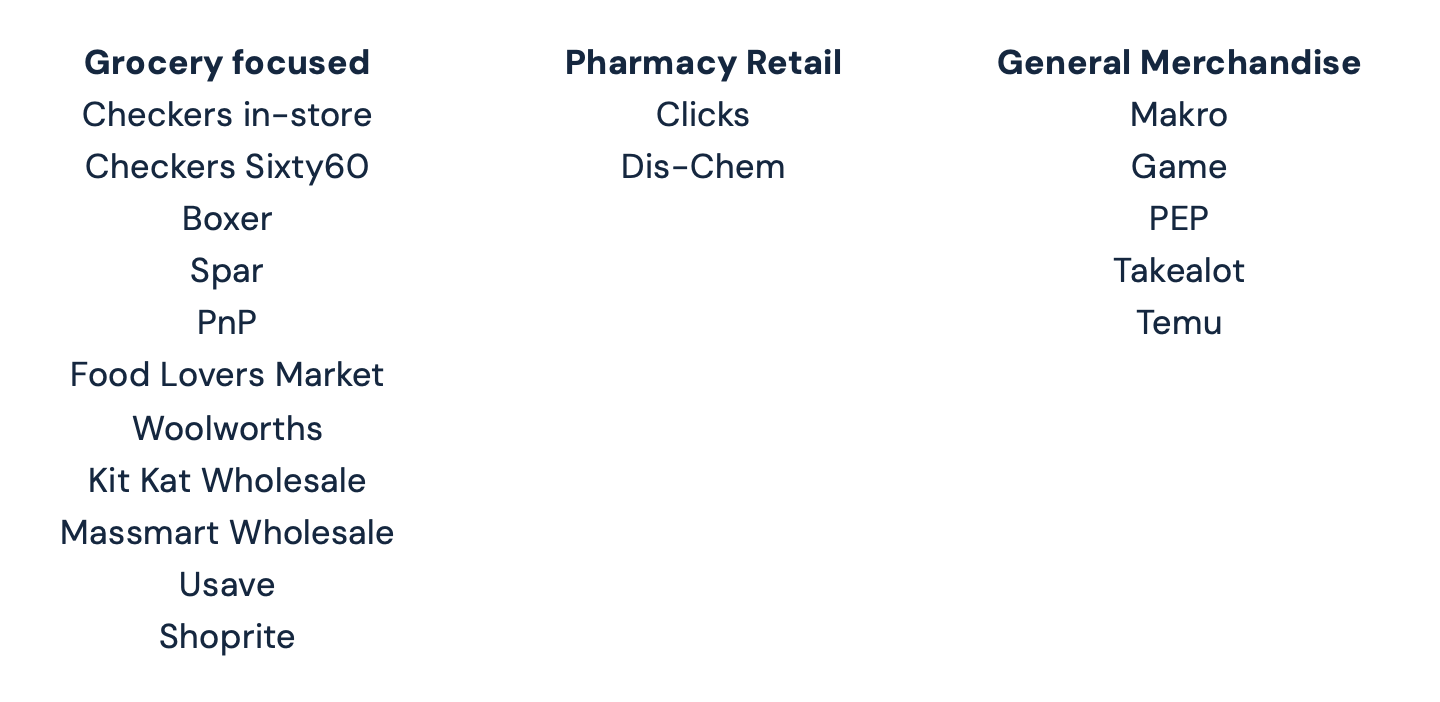
In their analyst presentations, Shoprite often references NielsenIQ – the market share data provider that aggregates sales from brands in these groups: Shoprite Group, Pick n Pay, Boxer, Spar, Clicks, Woolworths, Dis-Chem, Food Lover’s Market, Game, PEP and KitKat.
This group of retailers effectively defines the benchmark against which Shoprite, and the wider market, evaluates its performance. We include all these brands in our research too, but we believe the set is incomplete…
Defining a ‘market’ is always going to be subjective, but here’s why the Shoprite cluster, as defined by NielsenIQ, is problematic:
- It includes Game and PEP – both sizeable General Merchandise retailers – but excludes Takealot and Makro, which are also meaningful GM players.
- Checkers Sixty60 has expanded into GM – a sure sign that the category is relevant. Furthermore, sales of GM products must be contributing to Sixty60’s stellar growth, which means that their – and Checkers’ – market share gains are potentially overstated. In other words, they’ve been measured against a benchmark that excludes Sixty60’s largest competitors in the category (Takealot and others).
- The Nielsen set also excludes one of the fastest growing retailers in South Africa: Temu. In Slant’s GM and Home category, Takelaot is the largest retailer, but Temu is the fastest growing.
Taking all of the above into account, we’ve expanded the category definition to include these retailers:
As in fund management, performance attribution is a key feedback mechanism for stock selection. We believe that if we equip analysts with the data and the tools for performance analysis of retailers – all retailers – then stock selection will be improved.
Measuring loyalty
‘Market share’ measures a retailer’s performance against all other retailers in the market. It’s a construct that assumes that all customers have access to all retailers, or that all retailers target all customers. But take Boxer, for example – it’s well known that the discount retailer is under-represented in the Western Cape. And why measure Woolworths Foods against Shoprite – the actual supermarket chain – when they don’t target the same customer segment?
We think that Share of Customer Spend is a much better measure for evaluating a retailer’s performance. This metric isolates a particular retailer’s customers, and then measures the share of total spending by those customers at the retailer in question, and at all competitor retailers. In other words, by only considering the spending of customers who are known shoppers at a retailer, we can get a more relevant and accurate estimate of the proportion of total spending that retailer is capturing.
And what about loyalty? In a grocery retail context, this can have many interpretations. Analysts often refer to loyalty in relation to wholesalers like Spar – how much of a particular franchise’s total sales come direct, for example? Share of Customer Spend is a similar measure on the customer side of the aisle – how much of a known customer’s total grocery spend goes to one particular retail brand?
How do we calculate Share of Customer Spend? It’s all thanks to our unique database of consumer transaction data, which offers a view of individual customer spending across retailers. We can connect multiple transactions across different stores with the individual making those purchases – something that point-of-sale and loyalty-card data cannot capture.
Put simply, Slant’s large, representative sample of real purchases is a powerful tool that allows brand execs to track the relevance of their brands to their customers. For investors, our data benchmarks a retailer’s organic growth opportunities: Is a brand over-earning, suggesting that growth is unlikely to come from selling more to the same customers; or is there opportunity to capture more rands from customers already in the retailer’s stores?
These are important questions, so let’s unpack the analysis slowly; focusing on a single income bracket in the chart below.
In the R15-30k pm segment, spending at Spar accounts for 18% of total spending in the market, as defined earlier. This is Spar’s market share based on Slant’s data, but not everyone in our data in this income bracket shops at Spar…
Now let’s only consider the customers who have shopped at Spar in the quarter. Share of grocery spending at Spar – i.e. among Spar customers who also shop elsewhere – is 27.1%. This percentage is higher than the average Share of Customer Spend across all grocery retailers (24%), which suggests that Spar attracts an above-average share of spending in the regions and segments it operates in.
Market Share vs Share of Customer Spend
Income bracket R15-30k pm
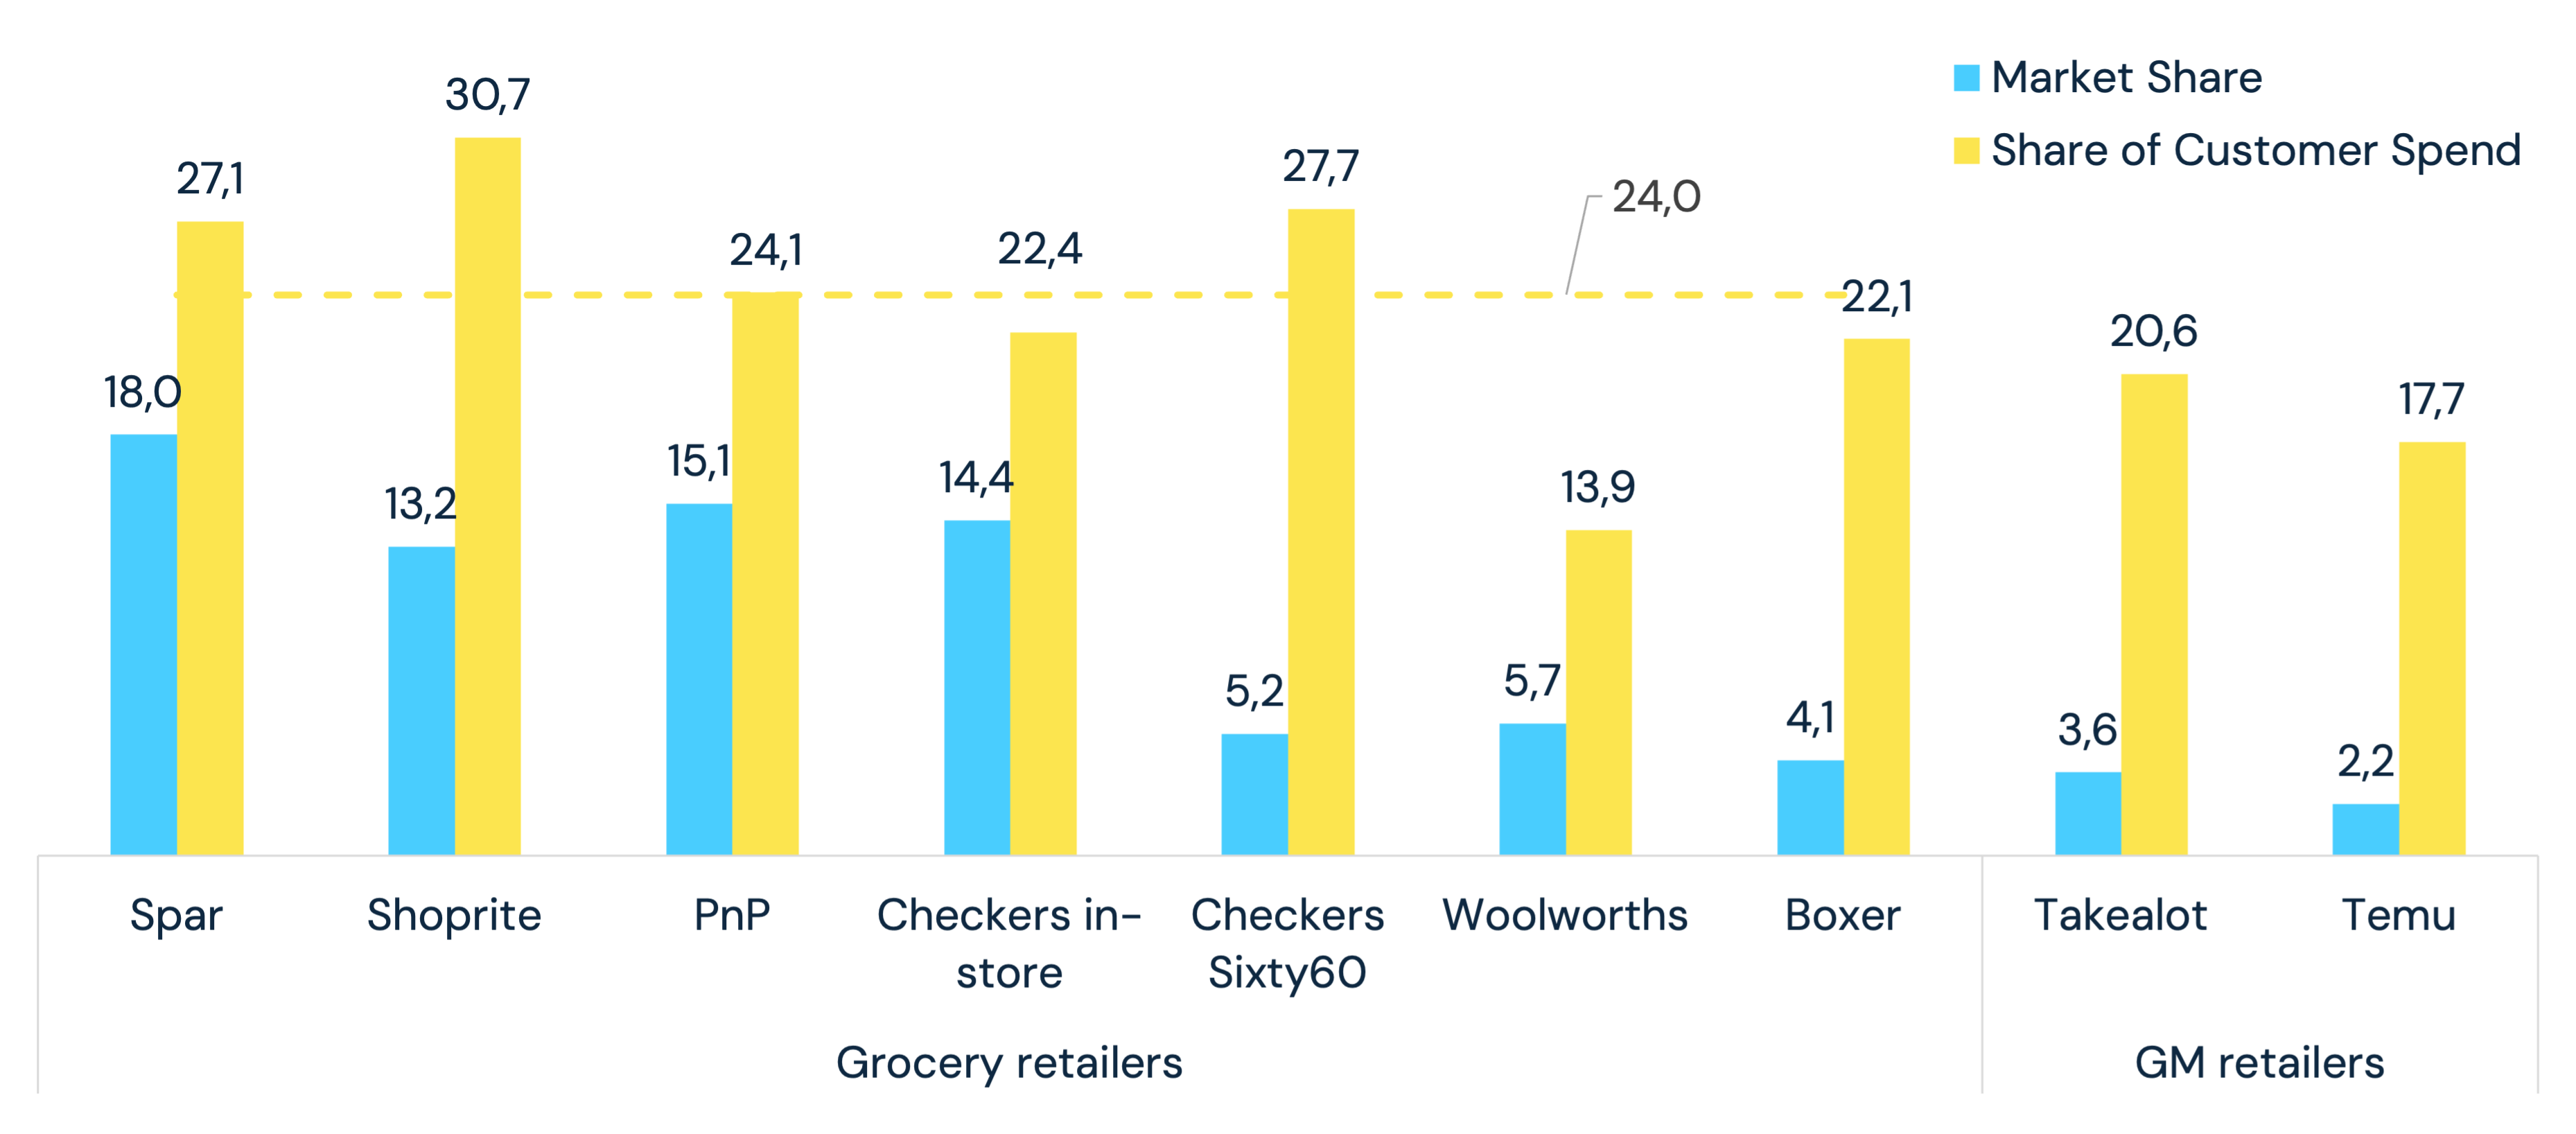
Shoprite has a lower market share in this income bracket, compared to Spar, but it attracts the highest Share of Customer Spend – a substantial 30.7%. We can’t be sure what the upper limit is, but all else being equal, we’d expect fewer opportunities for Shoprite to sell more to its current customers, compared to other retailers.
Checkers Sixty60’s market share is relatively low, but it earns the second highest Share of Customer Spend of all grocery retailers: 27.7%. Sixty60’s success has been well publicised and it dominates the on-demand grocery delivery channel. A low market share and a high Share of Customer Spend indicates a compelling opportunity to grow the number of Sixty60 customers, but it also suggests diminishing scope to extract more from existing customers.
It’s the opposite for Woolworths, which has the lowest Share of Customer Spend among the grocery retailers – an enticing prospect for organic growth (and something that we’ll unpack in a separate note).
Compared to the larger food retailers, GM retailers have lower market share. However, the customers who shop at Takealot and Temu spend 20.6% and 17.7% respectively of their total GM and Grocery budget at these two retailers. The average of this Share of Customer Spend (~18%) is a good estimate of the market share value at risk for the grocery chains: GM-type products that some customers might be buying at the grocery stores, but which they’re increasingly ordering online.
Share of Customer Spend also has a time dimension. In the next chart, we show the progression over the third quarter over the past three years, for two retailers: Checkers in-store (separate from Sixty60), and PnP.
Customers in the R15–R30k pm income bracket, who shop in-store at Checkers, have spent the same proportion of their total grocery wallet (22.4%) there over the three years. Fortunately for the broader Checkers brand, they have also allocated more to Sixty60, such that the broader Checkers brand has gained spending share from this cohort of customers.
Share of Customer Spend: Checkers in-store shoppers vs PnP shoppers
Income bracket R15-30k pm
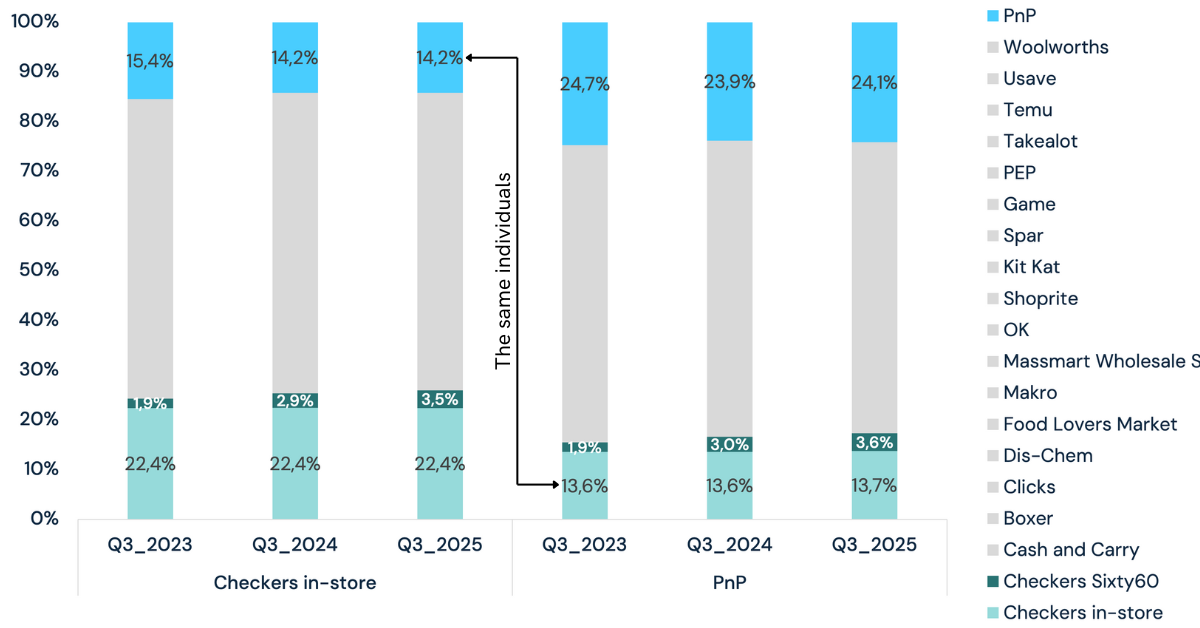
Some Checkers in-store customers also shop at PnP, but they seem to be spending less: From 2023 to 2024, their PnP share dropped from 15.4% to 14.2%, where it has remained stable.
It gets interesting if we look at the customers who shop at PnP, and analyse their split of spending share. As the right portion of the chart shows, these PnP customers might be spending the same at Checkers in-store, but they’ve increased their spending share at Sixty60 over the three years: 1.9% to 3.6%.
Spending share at PnP among their own customers declined between 2023 and 2024, and recovered slightly in 2025. The two-year difference is negative.
Using the data in these charts, the logical next step is to attribute changes in one retailer’s Share of Customer Spend to other retailers. If a retailer’s customers aren’t spending their rands in their stores, where are they spending those rands?
Let’s break-down the shifts in Sixty60’s Share of Customer Spend across 2024 and 2025. The blue bars on the left show that Sixty60 customers spent 1.6% more of their total grocery wallet at Sixty60 in 2024, and 1.7% more in 2025. The grey bars to the right show the breakdown of each year’s change.
Share of Customer Spend: Sixty60
Left bar 2024 change; right bar 2025 change
Income bracket R30-50k pm

- In 2024, Sixty60 customers spent 2.6% less of their grocery wallet at PnP – a gain for Sixty60 (and Checkers).
- However, Sixty60 customers also spent 0.7% more of their wallet in-store at Checkers, which is a loss for the Sixty60 business unit.
- In 2024, Sixty60 customers shifted a net 2.3% from Checkers’ listed retail rivals: -0.7% to Checkers stores, 0.3% to Shoprite, 0.7% from Woolworths and 2.6% from PnP.
- The main worry for Sixty60 is illustrated on the far right of the chart. Their customers spent 1.8% more at General Merchandise retailers in 2024 – the largest loss of spending share of all the retail categories. So, it’s true that Sixty60 increased spending among its own customer base, but those gains would have been higher if we hadn’t included GM retailers in this analysis.
When we aggregate these trends across all listed retailers (Checkers in-store, Spar, PnP, Boxer and Woolworths) – and across all income groups – a few consistencies emerge, which we’ve summarised in the next chart.
You need to be logged in to read further.
If you are a client, please reset your password and login using your corporate e-mail address.
Slant offers solutions for investors, corporates and data partners. Click the button below to get in touch and find out how our alternative data and class-leading research can help you.