
The metric to watch for Pick n Pay
This week, Pick n Pay reported results for the 2026 financial year. From an operational perspective, things are still tough for core, PnP-branded supermarkets in South Africa. There may be some early momentum in same-store sales growth, but this division is still expected to lose more than R1bn next year, after already losing R2bn this year; and the best case is that it breaks even in 2029.
Looking at the situation from a customer perspective, PnP management were clear that the fresh produce category has been an Achilles heel in recent years – a category that is usually higher-margin than other grocery items. PnP management were candid in admitting they’d lost this crucial basket category to competitors, and they’re aware that they need to win it back. In other words, improving the quality of fresh produce is an important catalyst to encourage customers to return to stores, thereby driving increased overall basket spend.
At Slant, we might not be able to see into a shopper’s basket, but we can sketch out the scope of work required if PnP wants to increase basket value – a better fresh produce offering being just one method of achieving this outcome.
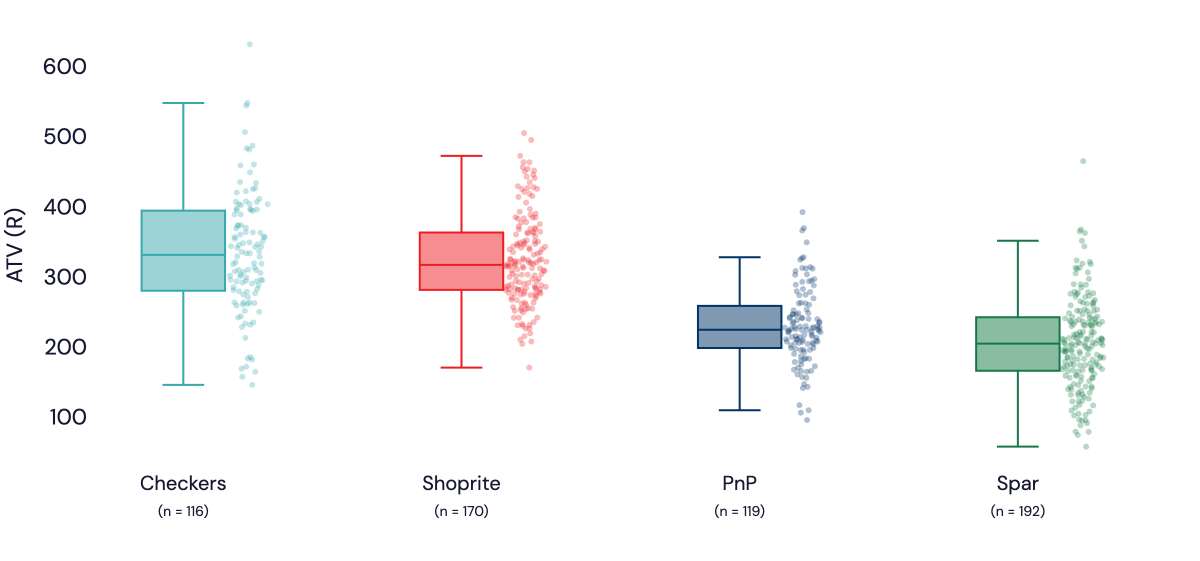
In the next chart, we contrast the average transaction value (ATV) in the last quarter of 2025 against PnP’s key competitors. Instead of a simple average, we’ve broken this down by store. Each dot is a different store – the visualisation therefore shows the distribution of each store’s ATV (basket size) and a comparison between peers.
It’s clear that ATV at the average Shoprite and Checkers store in our analysis is much higher than at the average PnP and Spar supermarket. (Online, Liquor, Clothing, Express and other non-supermarket formats are removed from the analysis.)
Spar has long been a convenience-focussed retailer. We’d expect its ATV to be lower, because frequency of purchase is higher. But PnP is a supermarket format that competes directly with Shoprite and Checkers, yet in our data, the ATV of the average PnP supermarket store is ~30% lower.
The distribution also says a lot about the extent of change required: three out of four PnP supermarkets has an ATV below the first quartile of Checkers stores.
Store ATV distribution by supermarket chain
4Q25
Below-average ATVs at store level are compounded by stores that are too large – an issue the PnP CEO has repeatedly called out in presentations. Shrinking stores and increasing ATV are therefore both necessary to increase sale densities, which might eventually drive a sustainable increase in profits for the SA Supermarkets business.
Fortunately, analysts can track ATV – and other metrics – in real time via the Slant Investor Portal.
Do delivery subscription services work?
Sixty60 Xtra Savings Plus (XSP) and TakealotMore are two examples of online delivery subscription services available in South Africa. While the specifics of each service differ, they both essentially offer subscribers unlimited deliveries from the namesake retailer, for a fixed monthly fee. The retailer accepts higher delivery costs but hopes to consolidate more of the customer’s spend.
But does this actually work?
Subscription service spending
4Q25, income bracket R30-50k pm
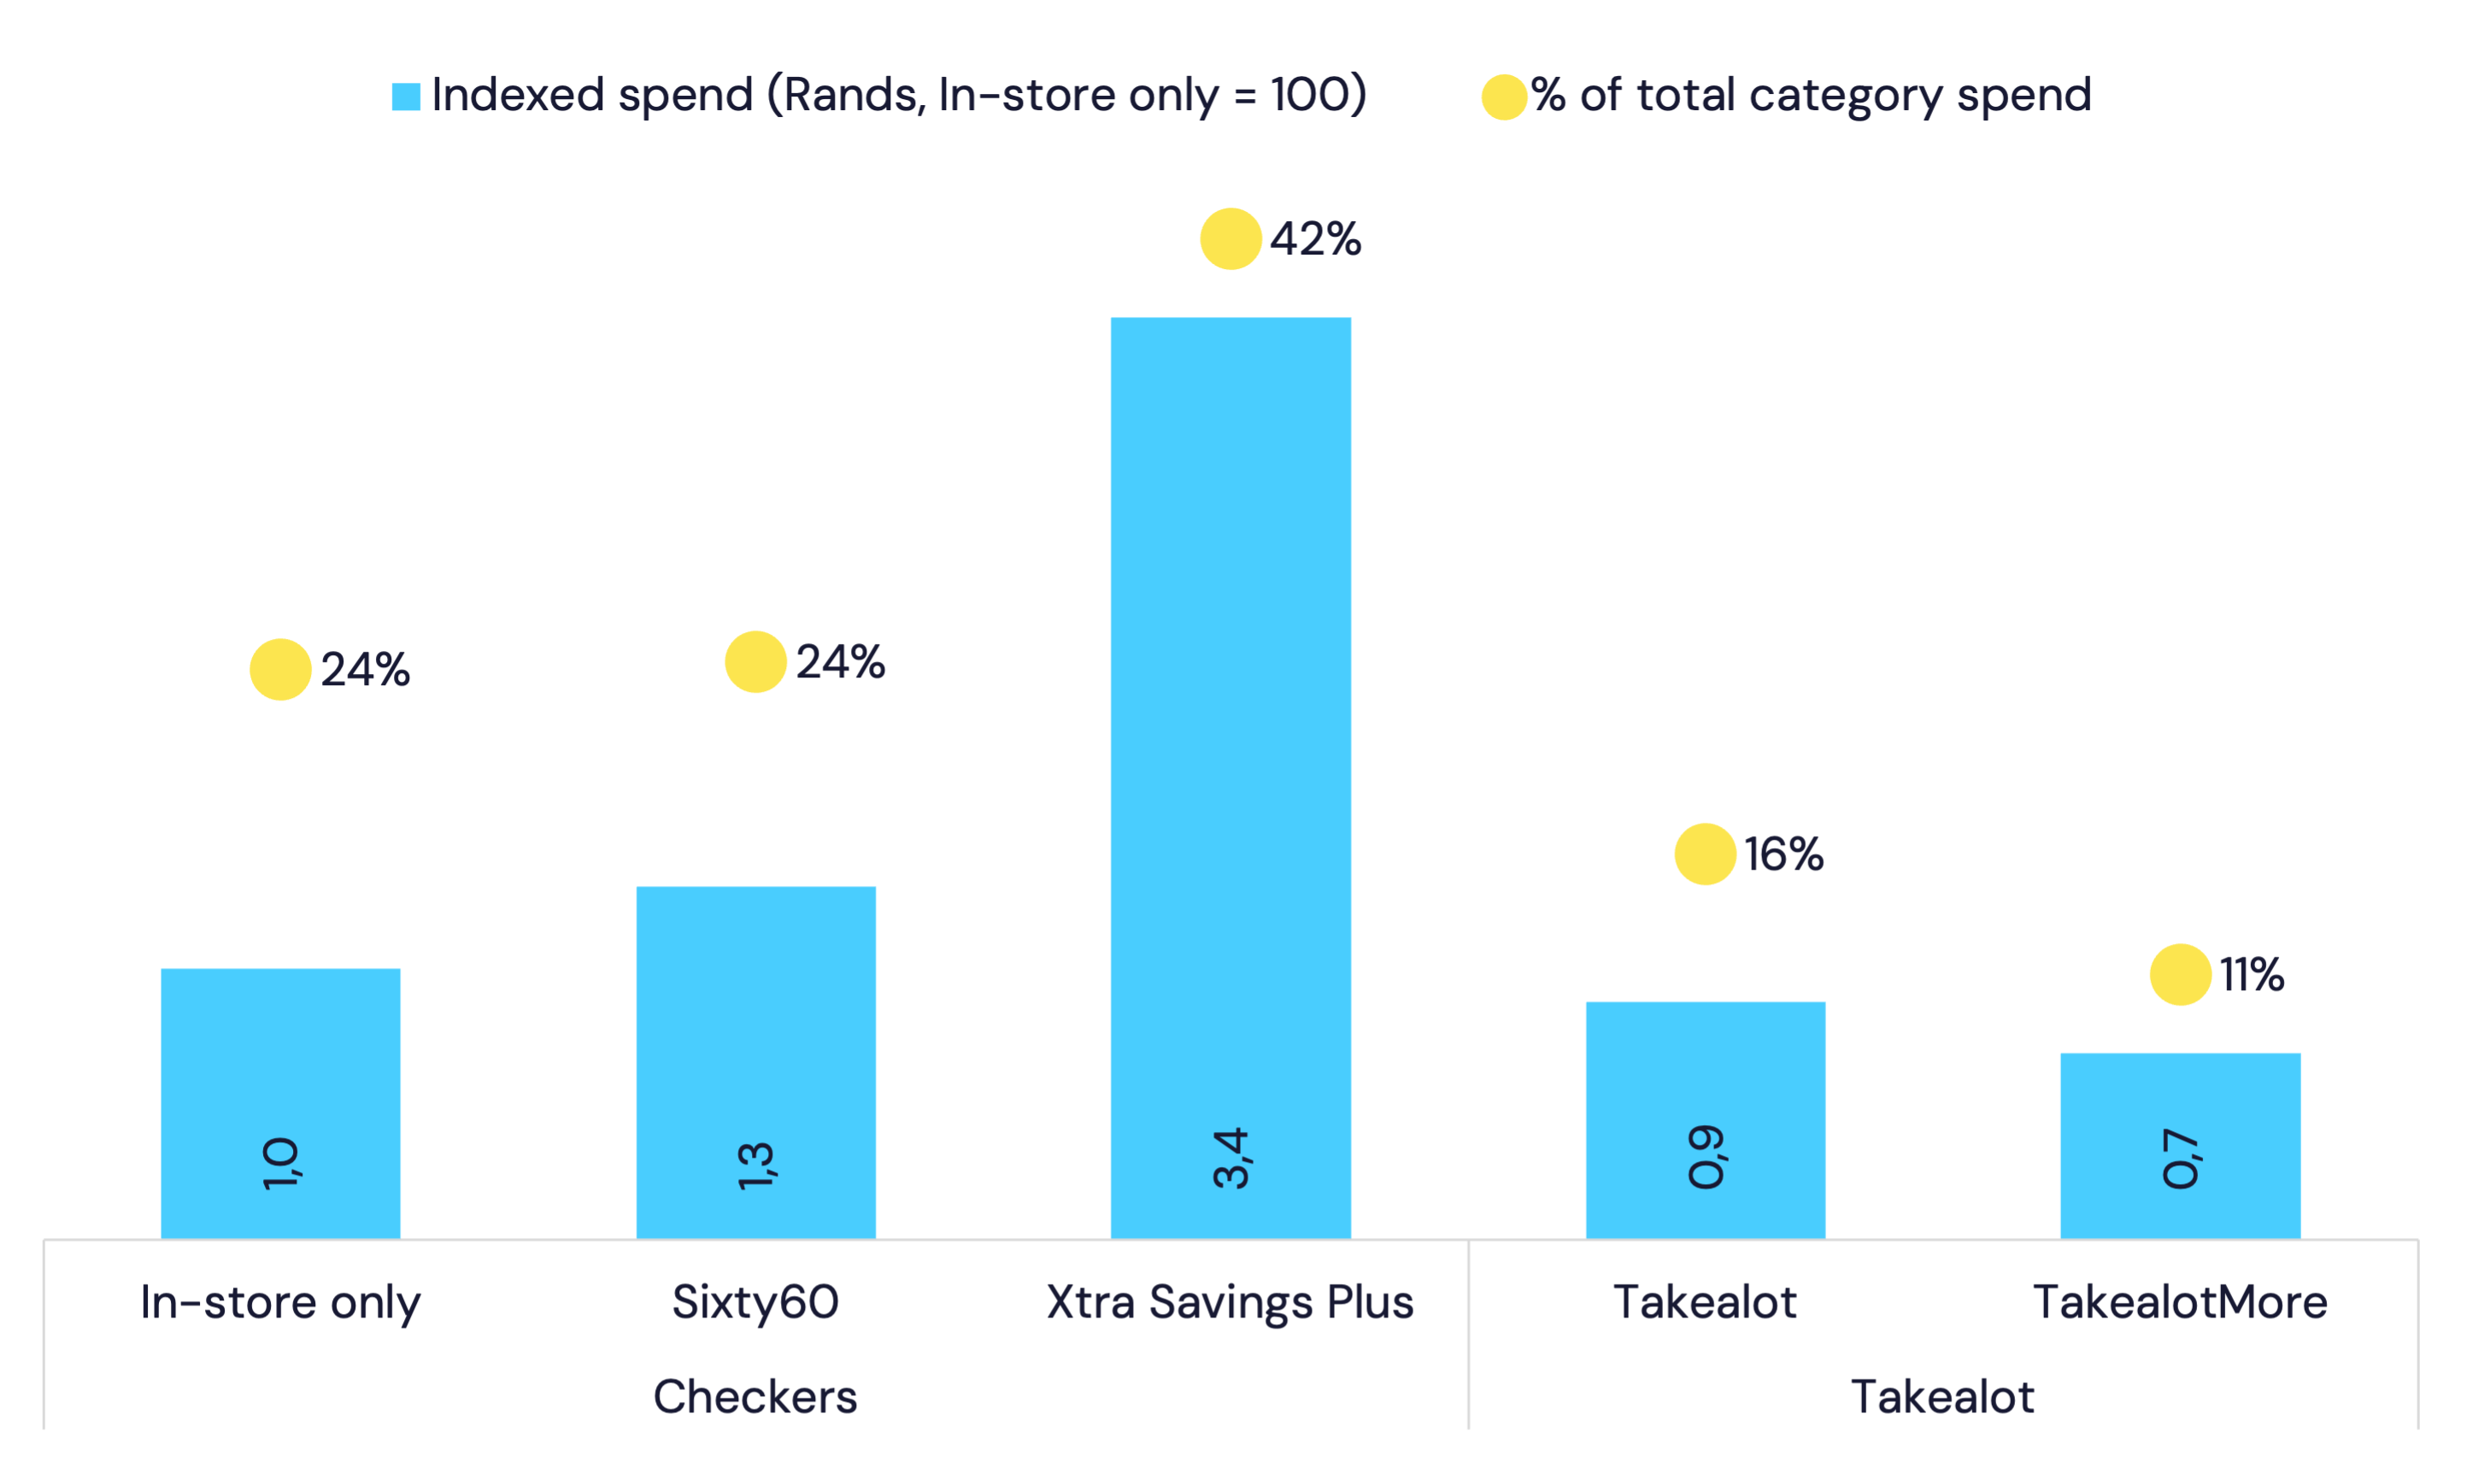
The short answer is yes – for some. As you can see in this quick spending analysis for the R30-50kpm income demographic in the last quarter of 2025, Checkers in particular is highly successful at consolidating subscriber spending via XSP.
The average XSP customer spends 42% of their entire category wallet on Sixty60, whereas non-subscribers spend 24% of their category wallet on Sixty60 – the same in-store spending share for customers who do not use Sixty60 at all. Rand spending is higher among Sixty60 customers (1.3x what a store shoppers spends) and XSP subscribers spend even more: 3.4x that of an in-store shopper.
Put simply, customers who are attracted to XSP spend a lot across this category, and Sixty60 receives more than 40% of their total spending.
The evidence for TakealotMore is less compelling. Our data indicates that the average non-subscriber spends more than the average subscriber – both in rands and as a share of total category spending.
Note: the sample sizes of the subscribing groups are much smaller than the non-subscribing groups, suggesting that adoption of both subscription services remains relatively niche.
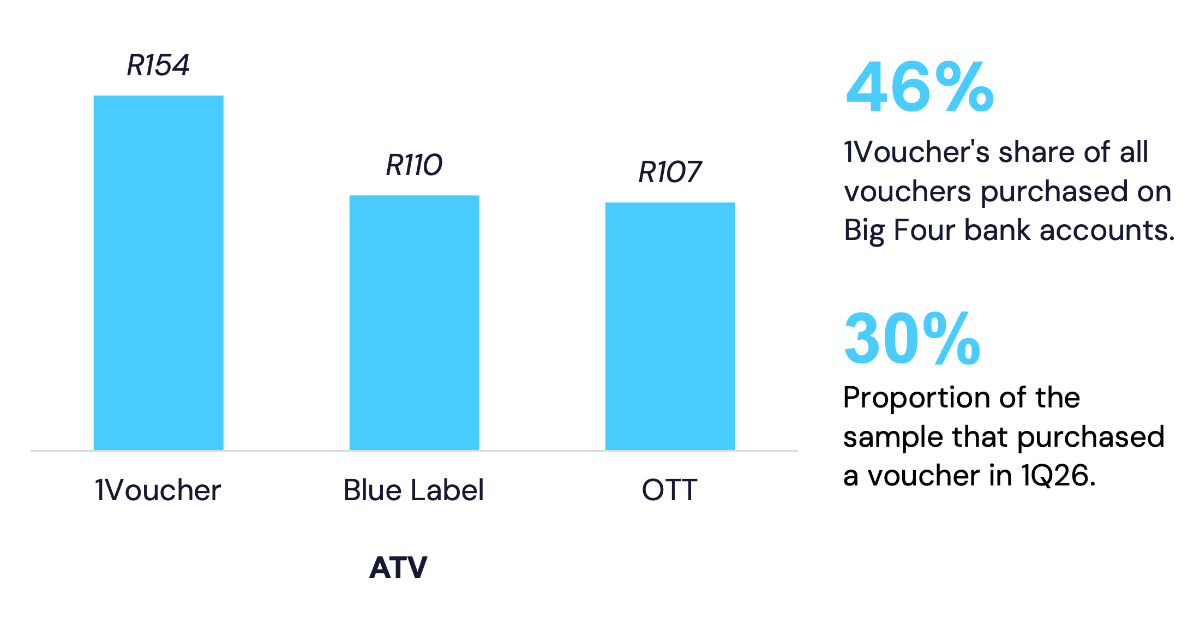
More than one voucher
Vouchers are an important part of Pepkor’s ‘Informal Market Platform’ segment, which continues to grow profits faster than the group’s core retail businesses. We have shown previously that the use of vouchers has increased rapidly over the past 12 months. In the first quarter of 2026, a remarkable 30% of the individuals in our sample purchased a voucher.
Although 1Voucher has an average ‘market share’ of 46% of all vouchers purchased across the Big Four banks, it’s not the only issuer and not always the largest issuer per bank.
OTT and Blue Label are also notable issuers of these products. Interestingly, the average value of a 1Voucher transaction is ~40% higher than the other issuers…
Average transaction value for select voucher vendors