

In October, a litre of petrol cost R30.25. In January, that same litre cost R20.75. That’s a 50% increase, thanks to higher global oil prices since the conflict in the Middle East erupted in late February. The fuel price initially declined in August and September, but higher oil prices subsequently triggered peak rates at the pump.
Our spending data shows that consumers spent 18% more at fuel stations in September 2027 than they did a year ago. Over the same period, the fuel price went up 25%. Combined, that means customers are buying 7% less fuel than they were, but they’re spending 18% more in total.
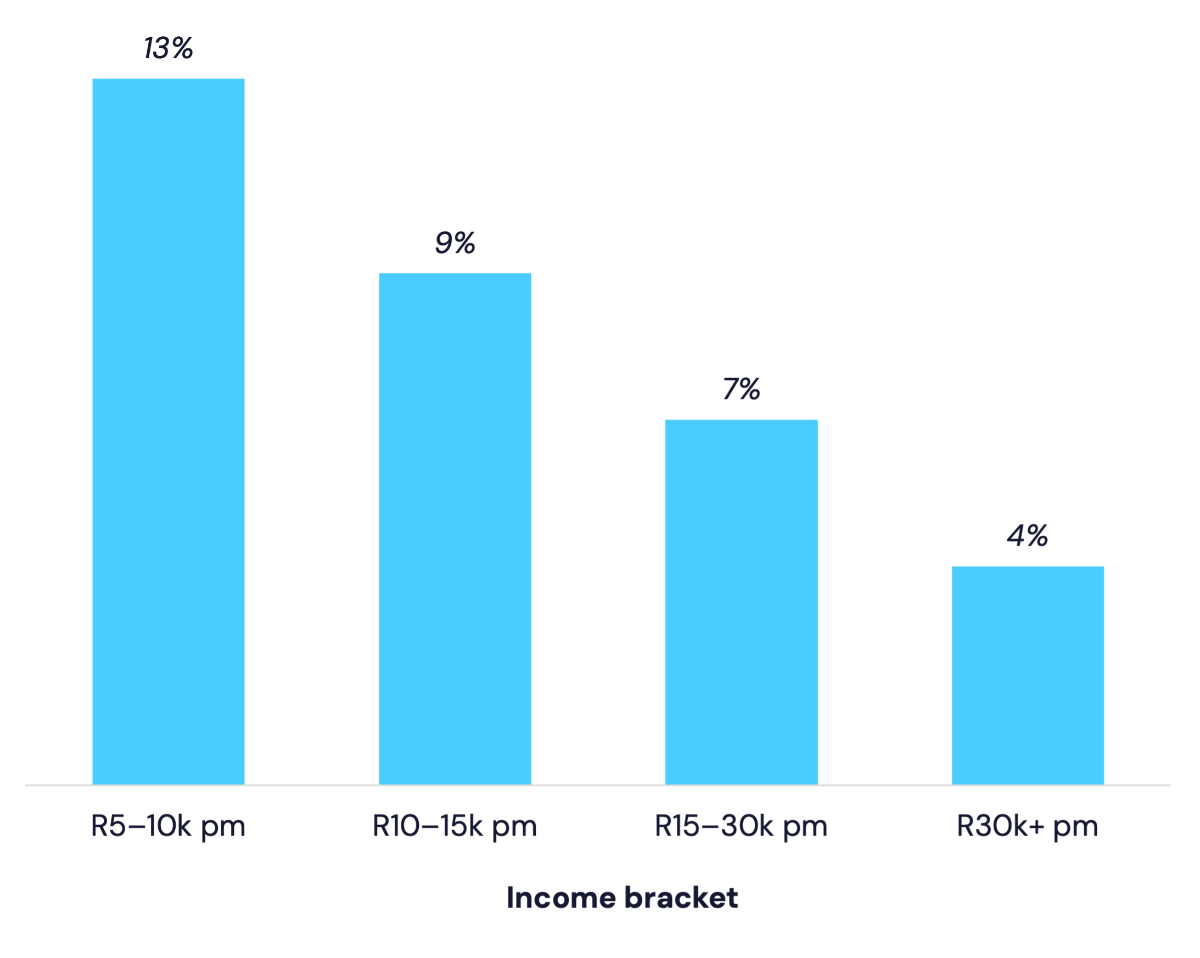
The pain on a consumer’s budget is regressive. In other words, those earning lower incomes feel it the most. For consumers earning R5-10k pm, Slant estimates that fuel purchases account for 13% of income – roughly twice the figure for consumers earning R15-30k pm.
Fuel spend as a percentage of income: September 2026
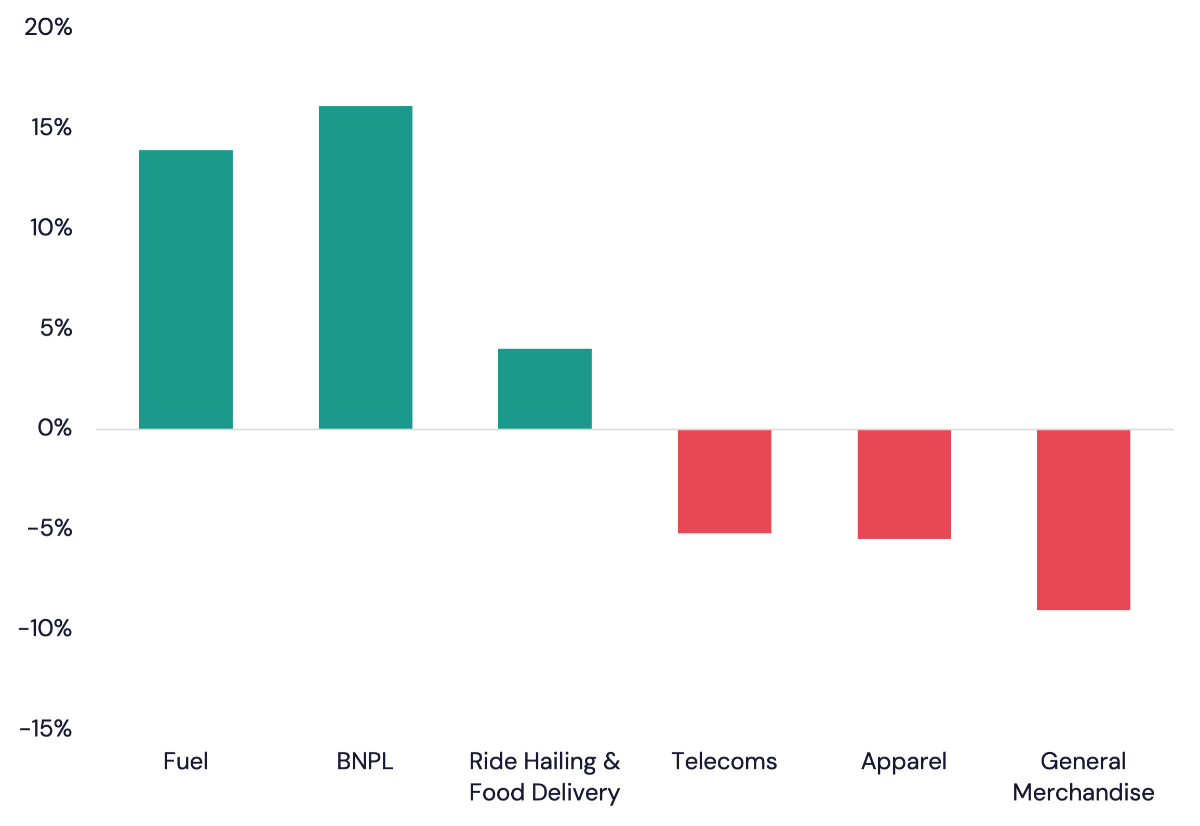
To balance the budget, consumers are therefore forced to cut spending elsewhere. Large spending categories, like groceries, and discretionary categories like apparel and general merchandise, are being sacrificed to accommodate the increase.
We also note that Buy Now Pay Later (BNPL) continues to gain spending share – perhaps to smooth the month-to-month pressure on the wallet – and that ride hailing and food delivery have both also gained share, suggesting that consumers find the cost of delivery more palatable than the cost of going out.
Annual change in spending share: September 2026
Looking ahead, adjustments to the Fuel Levy in November may offer a modest reprieve from even higher oil prices, but we also know that fuel spending peaks in December. Aggregating last year’s data, there were about ~7% more litres of fuel purchased in December compared to the average over the three preceding months.
If higher oil prices persist, expect discretionary spend to come under even more pressure. And expect even more delivery scooters to flood the streets…
Santam is heading to the mothership, but not for the insurance cross-sell
There may be ninety-one reasons why Sanlam would buy the shares in Santam that it don’t already own, but selling more short-term insurance to Sanlam policy holders isn’t one of them…
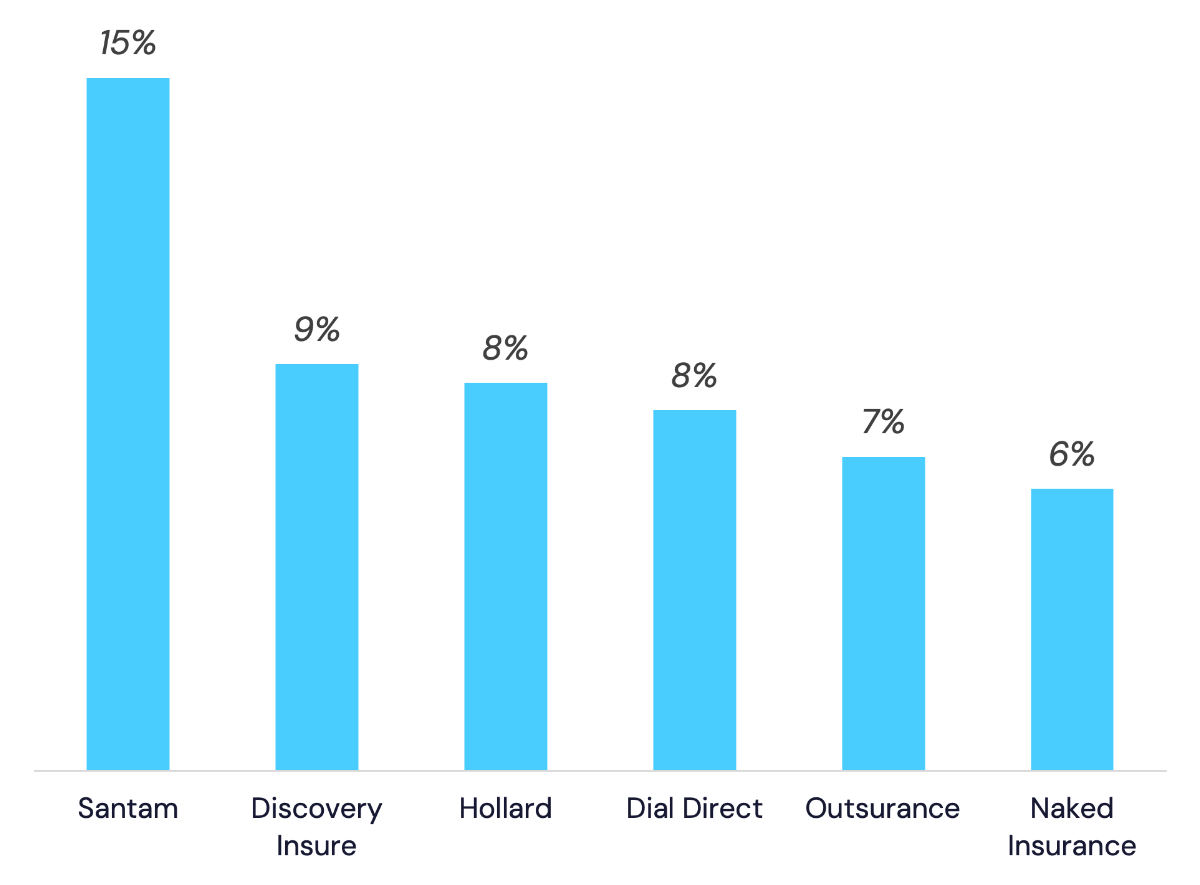
Our data shows that Santam is already over-indexed among Sanlam customers. The chart shows that 15% of Sanlam customers have a Santam insurance debit, compared to ~8% paying for insurance from other large, national short-term companies. These results are consistent across banks; they’re not an artefact of Sanlam’s past partnerships with Capitec.
Put differently, Sanlam clients are already buying a lot more cover from Santam than from other insurers. The acquisition is likely a move to defend this advantage, rather than extend it.
Distribution of short-term insurance spend among Sanlam customers
Joy to the Yam!
Another area of consumer spending that’s gaining share is smartphone rental and financing. Our data shows that FoneYam has overtaken PayJoy as the largest provider in this category. FoneYam was already a meaningful contributor to Pepkor’s earnings for the six months to March; we expect this contribution to grow when they next report.
Customer growth: FoneYam vs PayJoy
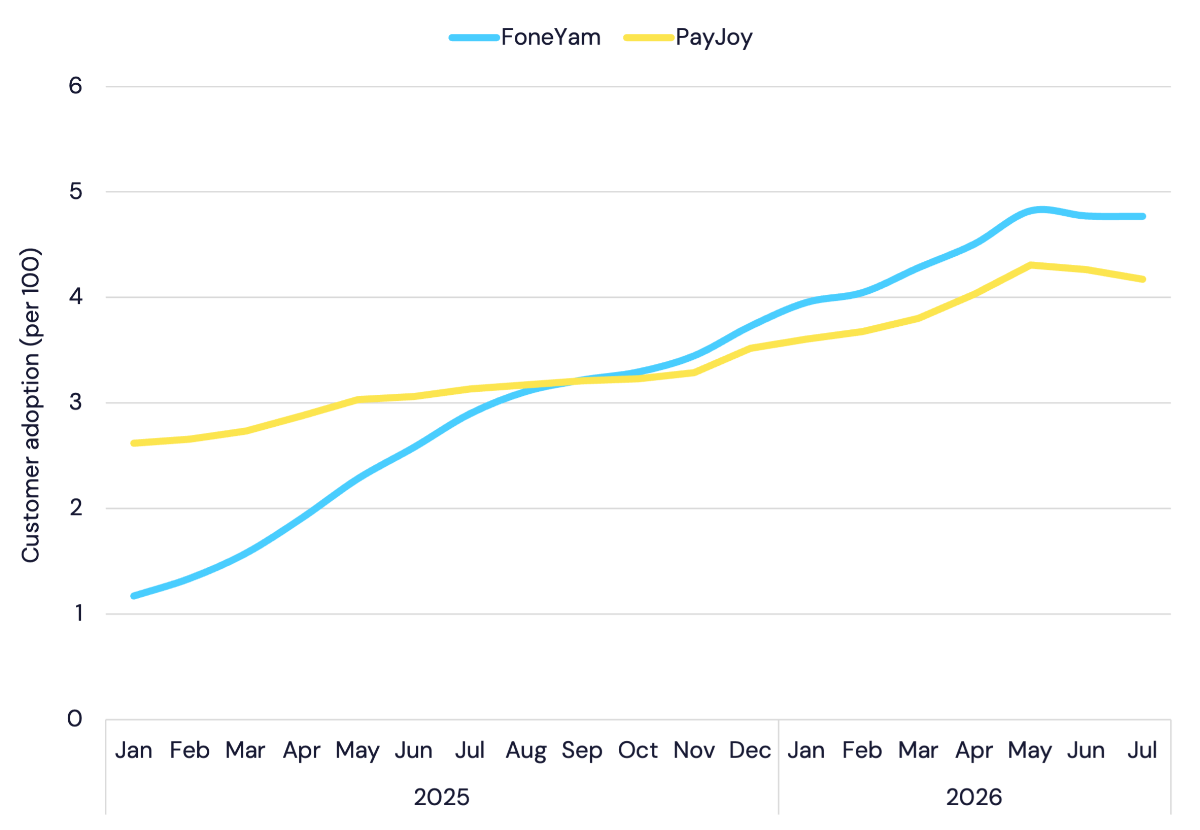
FoneYam and PayJoy do have slightly different operating models. We did a deep dive into FoneYam last year and can show that the average FoneYam customer pays R451 per month: 45% more than the average PayJoy customer (R311).
Latest market share trends
Wrapping up, we highlight a few notable trends in market share at a time when a number of retailers provide updates or results.
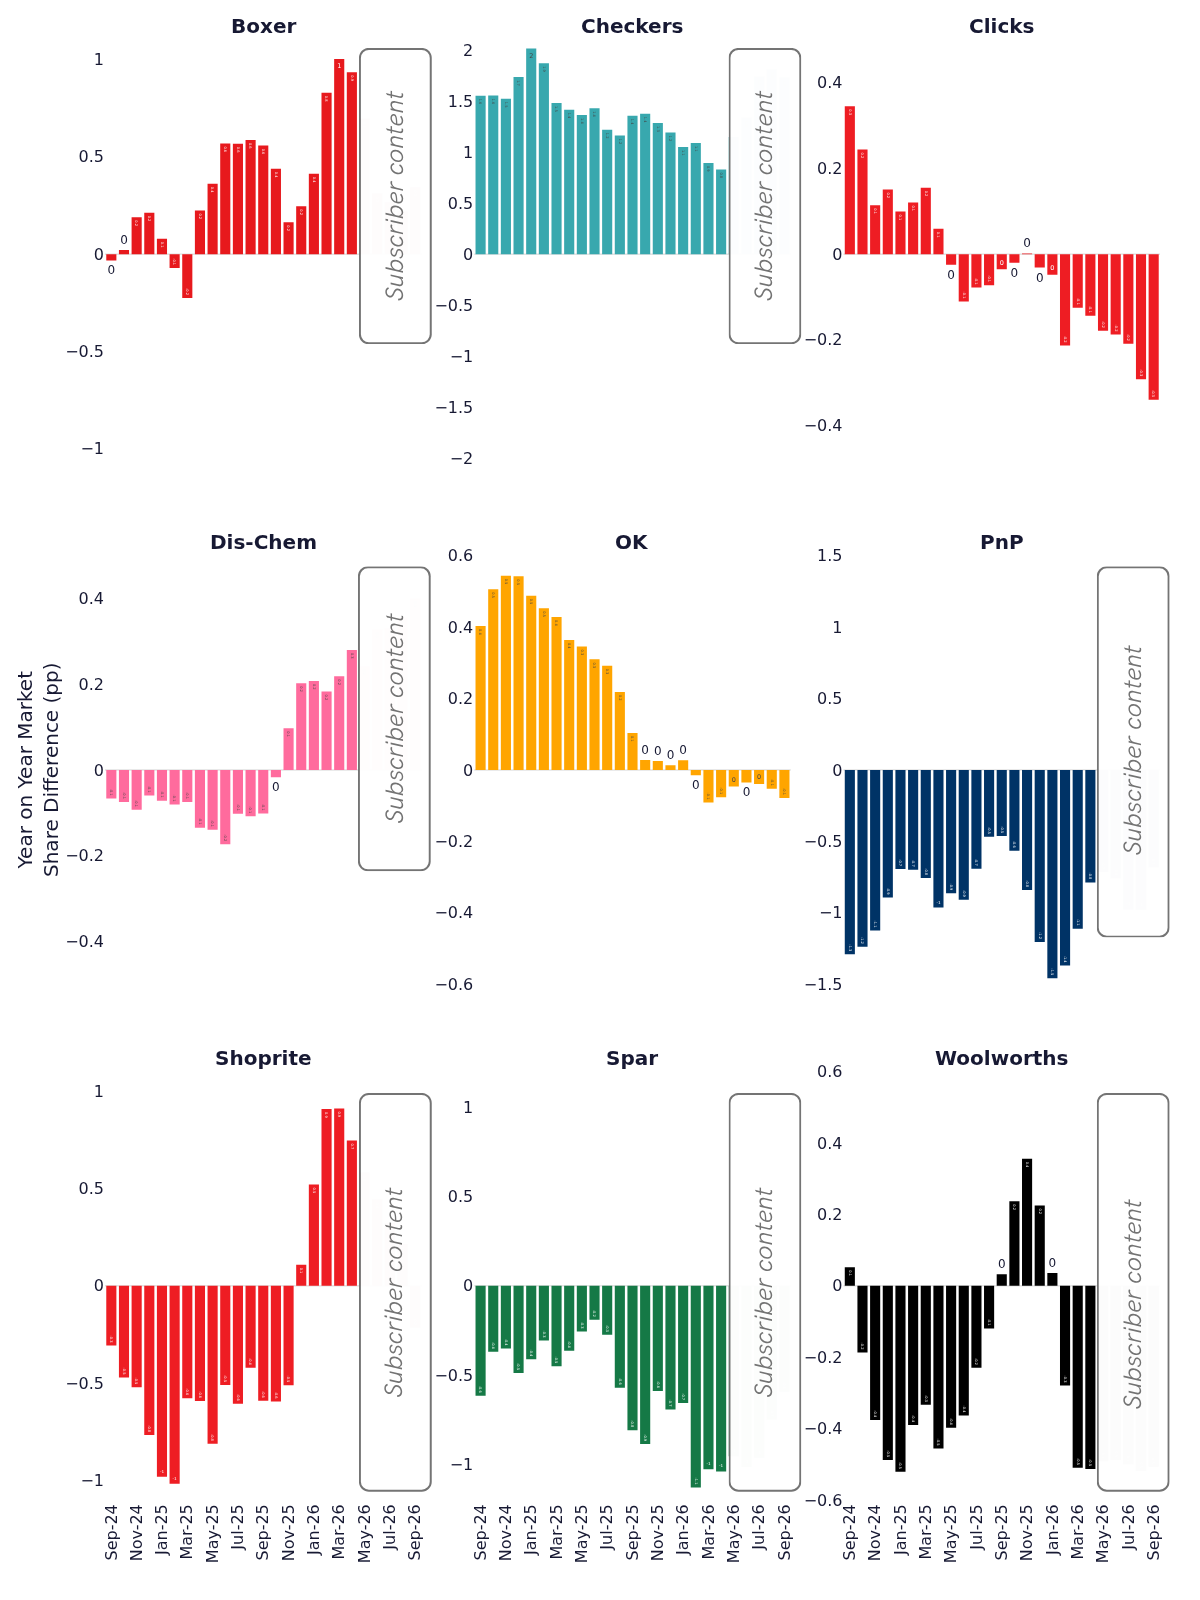
In the Grocery category, the slowdown in second-half retail sales that Clicks reported last week was evident in our data. Similar shifts in share are evident elsewhere and have been masked to preserve value for our clients.
Grocery retailers: Annual change in market share
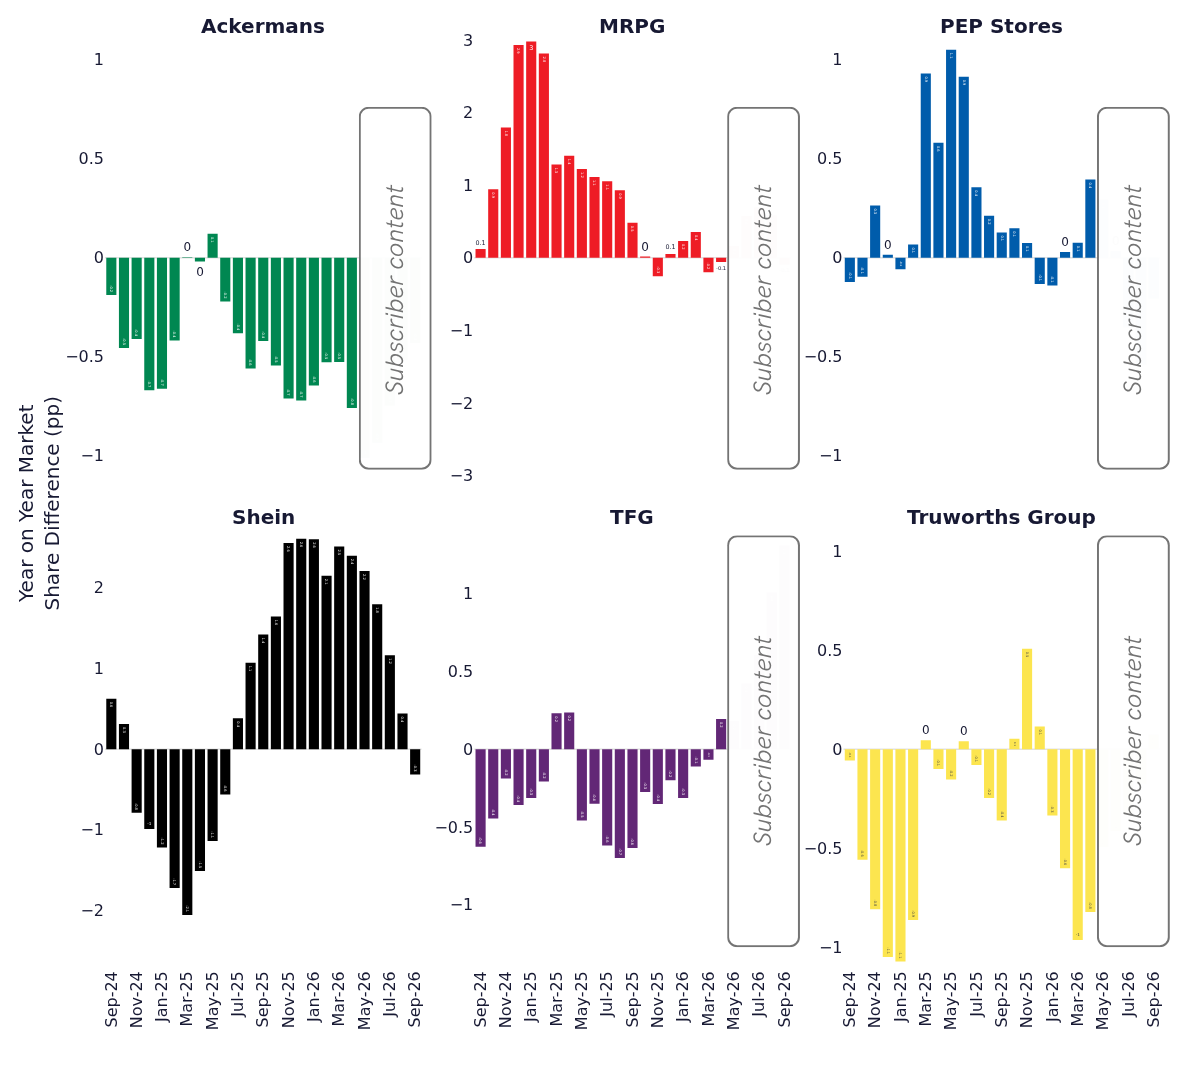
In the Apparel category, the trends broadly follow the same pattern we highlighted last month: the rolling over of Shein’s positive market share gains; and strong momentum at some domestic retailers…
Apparel retailers: Annual change in market share
Want to see the full picture? Contact us and become a subscriber.