

We’re excited to launch our analysis of consumer spending on insurance, including Naked!
This is an important milestone for Slant, extending our coverage beyond retail sectors and expanding client access to unique, relevant data that offers a real-time, granular view of South African consumer companies.
The local insurance market is well established and mature. The ~9 listed insurers have a market capitalisation of ~R600bn, roughly the same as the 15 listed South African retail companies.
Transaction data offers tremendous opportunity for detailed insight into the insurance market, but the nature of insurance necessitates a different kind of analysis. For example, since some types of insurance are likely to be paid by an employer – before an employee’s salary lands in their account – the market share metric is less meaningful than in Grocery or other retail categories. Instead, average customer spend per month (the premium), and other metrics, are more useful performance indicators for investors, allowing them to track brands in absolute terms and relative to other major players in the market.
Yes, insurance is complex, but we’ve managed to untangle some truths that we’ll share below. This is our first pass of the data – we identified more than 60 brands in the category that offer a variety of insurance types: short term (motor and household), medical aid, life, funeral, and specialist categories like pet insurance and medical gap cover.
We’ve included direct-to-consumer brands like OUTsurance and MiWay, and emerging challengers like Naked and Pineapple. We’ve captured the listed behemoths like Discovery and Santam, and the private giants like Hollard and Telesure.
The purpose of this report is to showcase the data and the tools we offer, to better understand the overall market, relative brand positioning and performance, customer demographics and other indicators.
It’s also an invitation to clients: Tell us what you want to know and we’ll mine the data to find the answers.
An example of Slant’s broad view of the types of insurance captured in our data is shown below. The chart illustrates the average monthly premium paid by the ~200,000 consumers in our sample. It shows how premiums vary from ~R100 for specialist cover to R4,000+ for medical aid.
For the purpose of our analysis, we’ve defined four sub-categories: Funeral, General, Health and Life. (Again, we’d welcome input that would help us deliver a cleaner market segmentation.)
Select insurers across major sub-categories
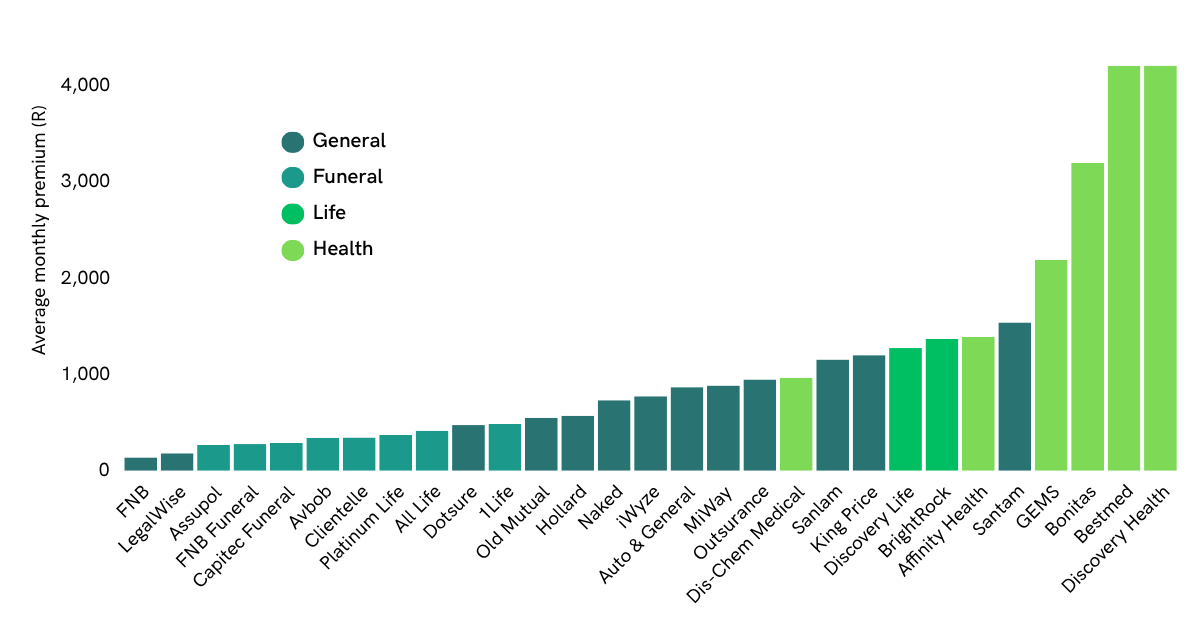
The data shows clear stratification by sub-category: Funeral attracts about R300 per month; General spans a wider range of about R750 per month; Medical is most expensive.
Data for each of these insurance brands is available to clients via the Investor Portal. To demonstrate how the data can be interpreted, here’s a short case study.
Naked numbers
Let’s use the spending data to compare four insurers that offer relatively similar cover: Naked, OUTsurance, Santam and MiWay (owned by Santam).
The chart shows the average monthly premium during 2024, for customers earning R15–30k per month. The lines are stable, which indicates robust estimates derived from the large transaction samples in the data.
Average monthly premium during 2024
for customers earning R15–30k pm
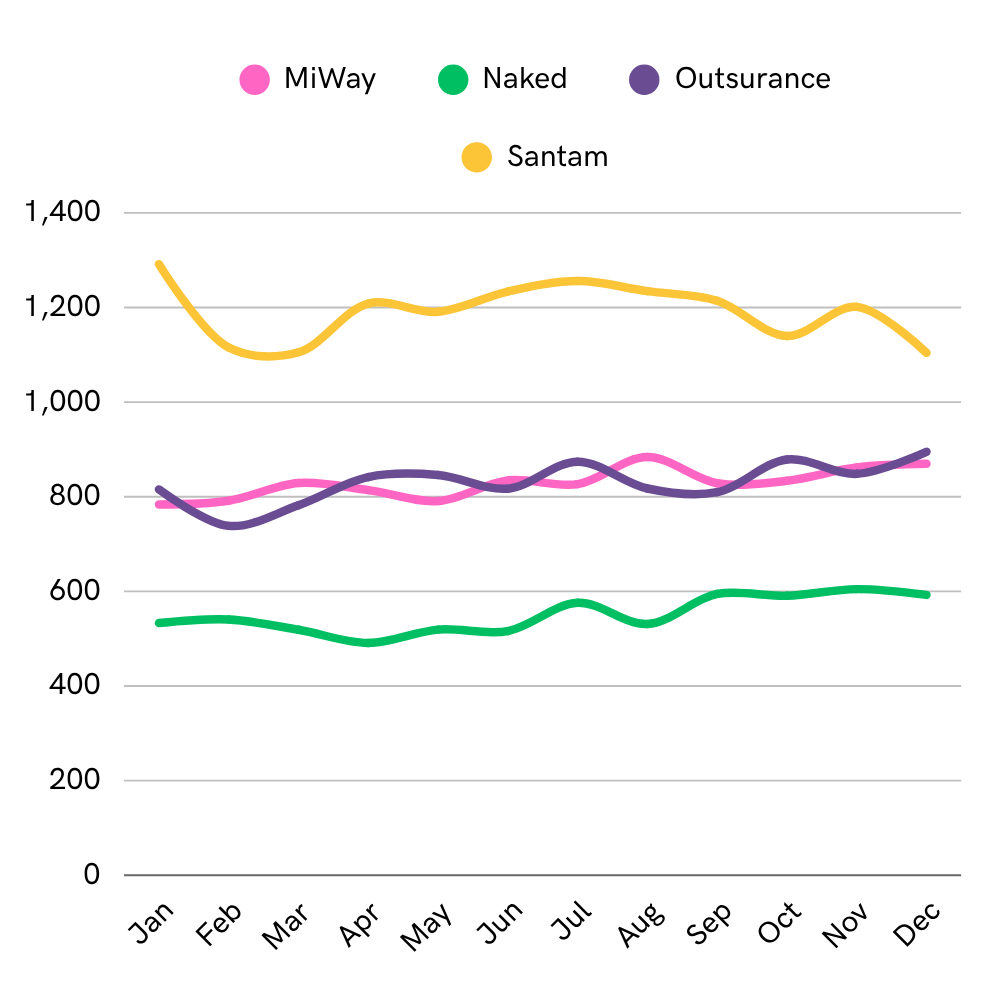
On average, Santam is the most ‘expensive’ insurer of the four. Of course, we don’t know exactly what these premiums cover… We’ll come back to this.
Interestingly, in this income bracket, MiWay is competing head-on with OUTsurance: average premium spend for both brands tracks almost identically over the course of the year.
On average, Naked has the lowest premium. Does that mean it’s the ‘cheapest’? Again, we don’t know if the risk being underwritten is comparable, but we can slice the data differently to get closer to the answer.
If we assume that an average customer’s demand for a particular type of insurance is relatively consistent – i.e. the average customer in a specific demographic or life stage requires X amount of short-term cover – then we can compare a customer’s total spending across brands in that category. If a customer is not fully satisfied with their cover from one insurer, they might top up at another: car insurance here, household cover there… We call this ‘customer-up’ analysis and we’re only able to do it because we can track overall spending at a customer level. The inference is that if one brand’s customers are spending more to top up their cover at other insurers, chances are they’re not fully satisfied with the extent of the cover they’re getting from that particular brand.
For the purpose of this customer-up analysis, we’ve narrowed the data to general, short-term insurance, and we’ve focussed on a single demographic: customers earning R15 – 30k pm, aged 26–35.
Total spend on general insurance for
customers earning R15–30k pm, aged 26–35
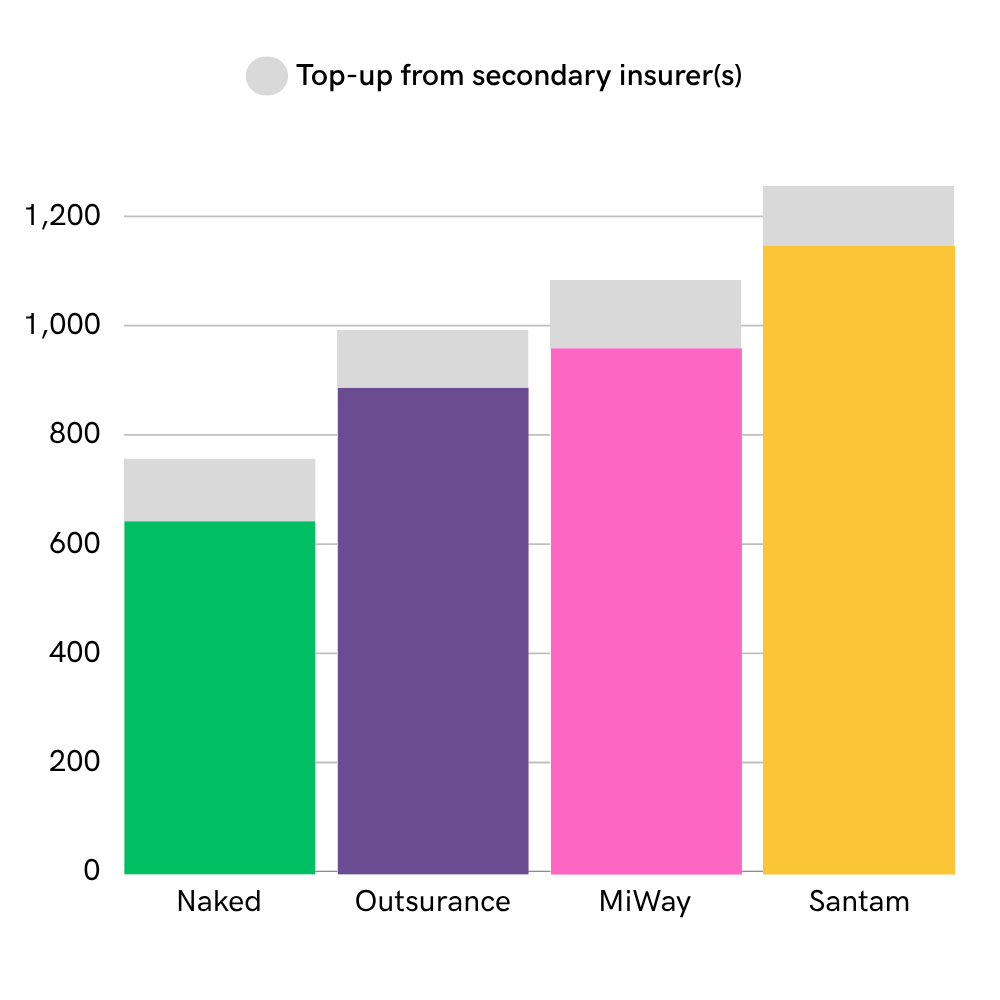
The chart shows the average total customer spend at the four insurers in the case study. MiWay customers in this segment spend R1,083 across all general insurers in our data. Most (R958) is paid to MiWay, with the rest (R125) allocated across the industry to other providers, for any additional cover that some MiWay customers might take out to supplement their needs.
In this peer group, Naked customers spend the least in total; Santam customers spend the most.
Since we’re controlling for age and income, our thinking is that this is a good measure of a specific customer’s total demand for general insurance. In other words, for this group of customers, their general insurance demands are primarily being met by their primary insurer, and some choose to spend more to enhance their cover. Interestingly, the average top-up amount is ~R110. Even with this included, Naked customers spend less on premiums than customers of other insurers.
Age and risk
Another way to evaluate long-term growth potential is by looking at age demographics. The chart shows the age profile of the four brands in our sample.
Proportion of sample by age
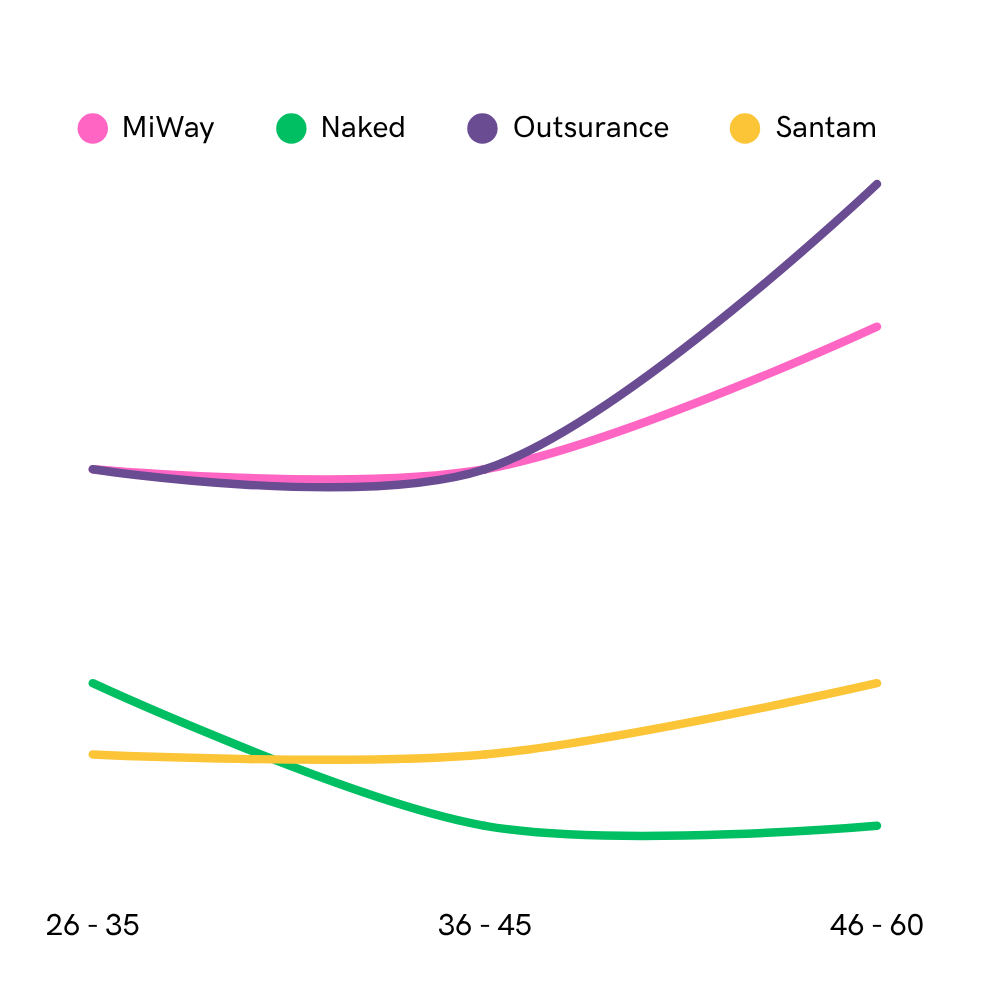
Naked might have fewer customers than its competitors in this example, but it’s the only insurer with a downward-sloping age profile, signifying that it has more young customers than older customers. All else being equal, this bodes well for future growth.
Also note the exaggerated contribution from OUTsurance customers in the 46-60 age bracket, which could impact future growth. Some shareholders might want to interrogate this specific data outlier further, as it implies that OUTsurance may not be replacing customers as quickly as it’s potentially losing them.
Lapse rate and profits
A key earning metric for insurance companies is the ‘lapse rate’ – the percentage of policies that are terminated or allowed to expire without being renewed or maintained. A high lapse rate undermines profitability: insurers spend money acquiring customers and issuing policies, but don’t recover enough premiums over time.
From the customer perspective, a high lapse rate indicates affordability or product suitability issues. Policyholders might be unable to continue paying premiums, or they may no longer see value in the cover.
Again, our data gives us unrivalled access to a cross section of customers and insurers, allowing us to compare this metric across brands – something of great value to our clients.
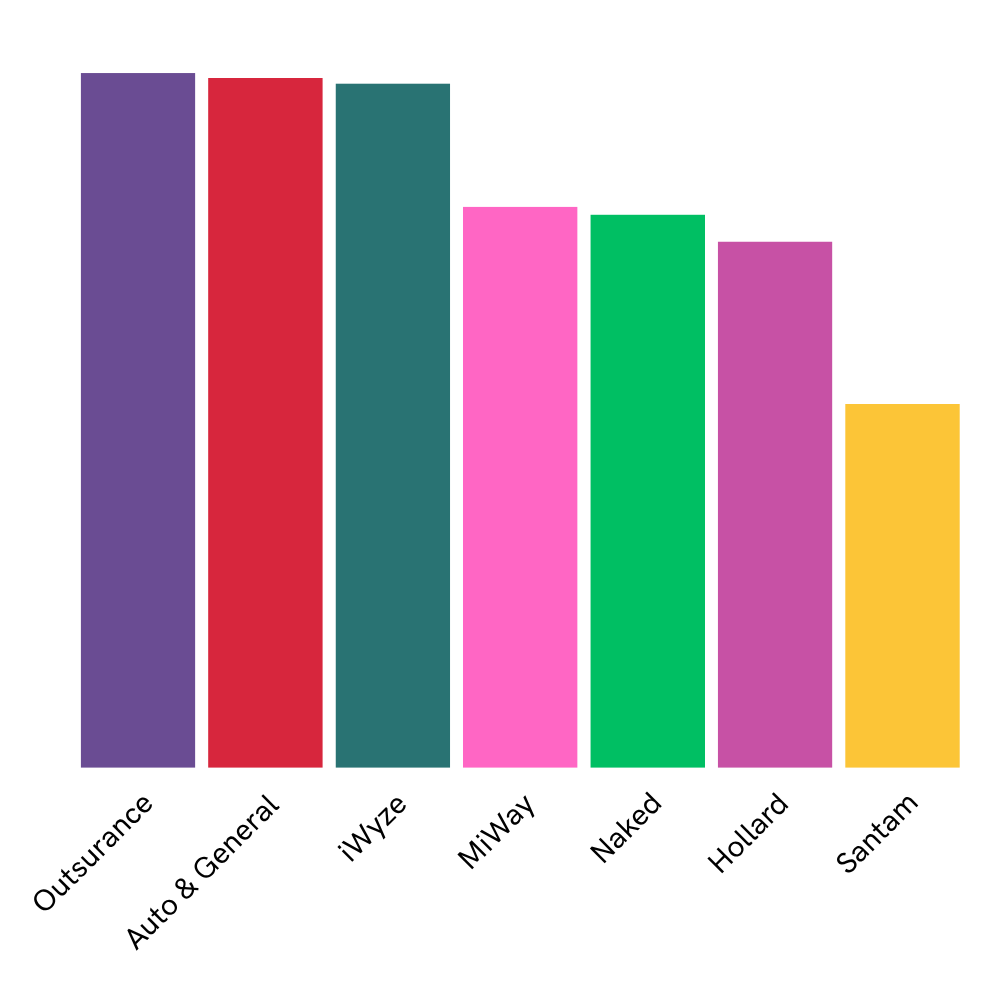
The simplified chart below shows our estimate of the average lapse rate for a select group of insurers, calculated as the proportion of customers in the previous month who fail to pay the same brand in the current month. It’s fascinating to see how insurers rank on this measure.
A lower lapse rate is better, and Santam has the lowest in the group. Naked is on par with MiWay, and both perform better than OUTsurance.
Average lapse rate for select insurers
Tracking lapse rate and other key metrics over time is likely to offer clients a deeper understanding of the overall insurance market, the positioning of their brands, and the relative performance of competitors.
There’s more to come
This is merely an introduction to the insurance spending data now available from Slant. As has been our experience in other categories, we’ll continue to refine and update the data and interrogate the numbers to highlight relevant trends for clients and investors.
This data is available to clients in real-time (click below). Stay tuned for more research from this important spending category.