
Selling alcohol is big business for retailers. Take Shoprite’s LiquorShop – the group reported R17bn in revenue for the 2024 financial year and 18% growth per annum since 2019 (sifting out the rollercoaster Covid period), largely driven by an 11.5% pa expansion in the number of stores. LiquorShop now accounts for 9% of total sales in Shoprite’s mighty Supermarkets South Africa division.
To put that 18% pa growth rate into context, Shoprite branded supermarkets have grown sales by 10% pa over the same five-year period. Checkers – riding on the success of Sixty60 – ‘only’ increased sales by 13% pa over the period.
It’s clear that booze has boosted Shoprite Group’s revenue growth, and we could demonstrate similar trends at SPAR and PnP. The question is this: Can liquor continue to do the same for these listed groups over the next five years?
Nationwide, there are more than 2,150 liquor stores operated by SPAR, Shoprite and Pick n Pay. Our goal with this note is to leverage our unique view of actual customer spending to give analysts a better understanding of the runway for the listed retailers’ liquor formats.
Pre-drinks
To compile this note, Slant identified ~2 million transactions at liquor retail outlets across 10 national chains, like Tops at SPAR, Overland Liquors, Ultra Liquors etc. We also identified hundreds of thousands of transactions at various smaller liquor stores, like this one near Durban.
Slant has steadily built up a comprehensive transaction view of consumer spending. Our latest data encompasses a significant portion of consumers’ monthly expenses – everything from groceries to restaurants and mobile – sliced by income, age and province. We call it ‘Share of Wallet’ and it allows us to contextualise a specific spending category and compare it to others.
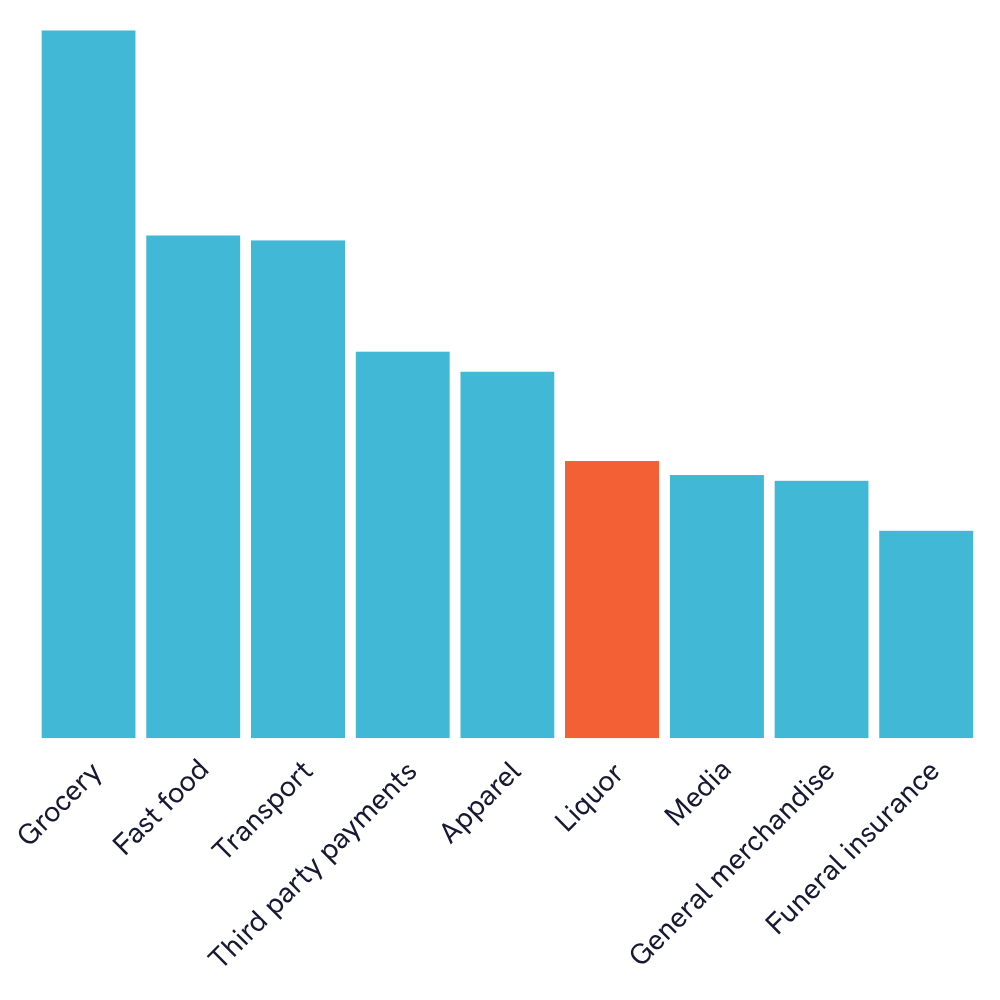
See the chart below, which shows the number of customers shopping in each category. Although Liquor may seem low down the pecking order, its position is best interpreted relative to its neighbouring categories. For example, let’s look at spending during Black Friday in November, and over the December holidays. Of the ~220,000 customers in our data set in 4Q24, more customers purchased from a liquor store than at any of the 60+ retailers in the General Merchandise category – essentially every national retailer we can identify that is not in the Apparel or Grocery category. That’s a lot of customers in anyone’s book, and one of the indicators of the true size and transaction frequency within the Liquor category.
Number of customers per spending category
We mentioned Black Friday and December… The first chart in the next series shows that liquor spend per person is highly seasonal, with big spikes in November and during the summer holidays.
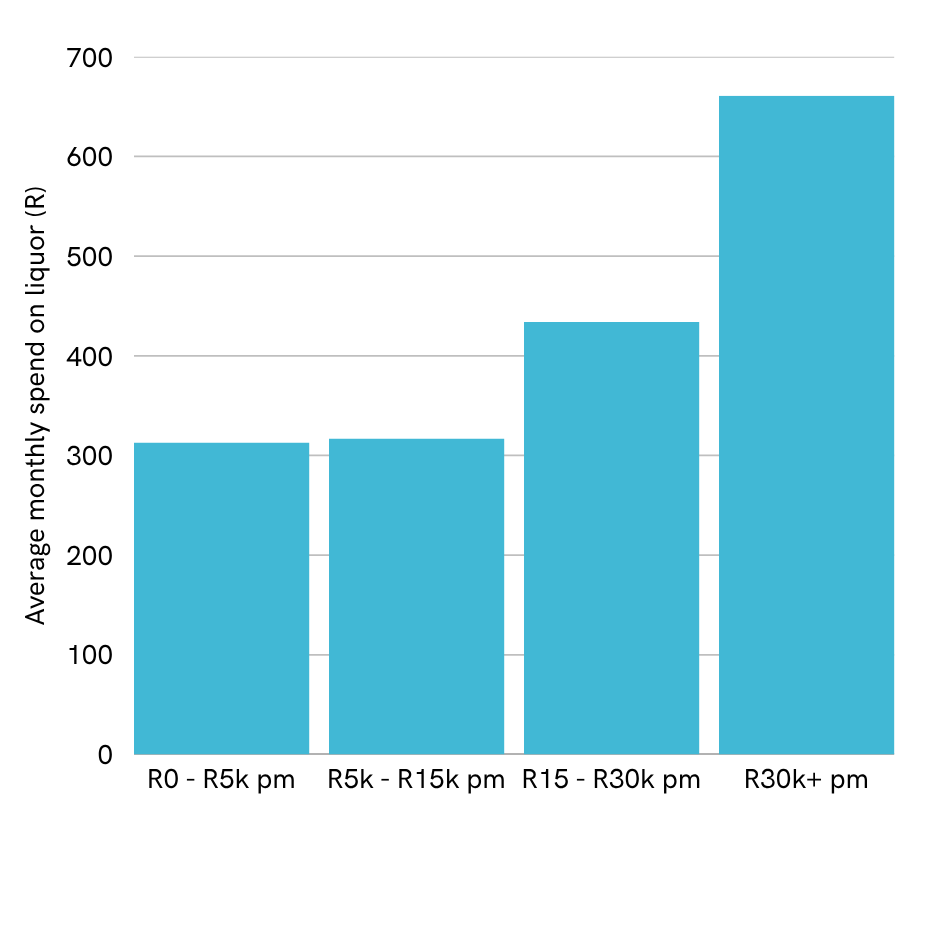
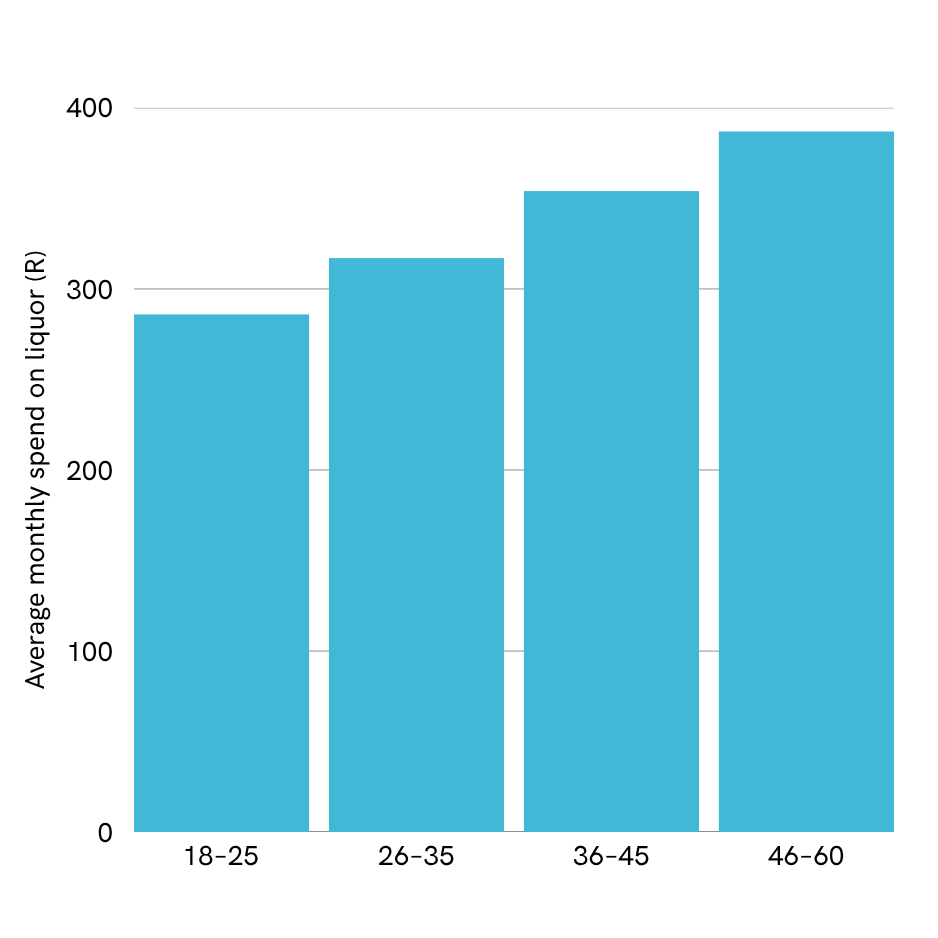
What else does the data show us? Spending on liquor varies depending on income and age, although the former has a far more significant impact on spend than the latter.
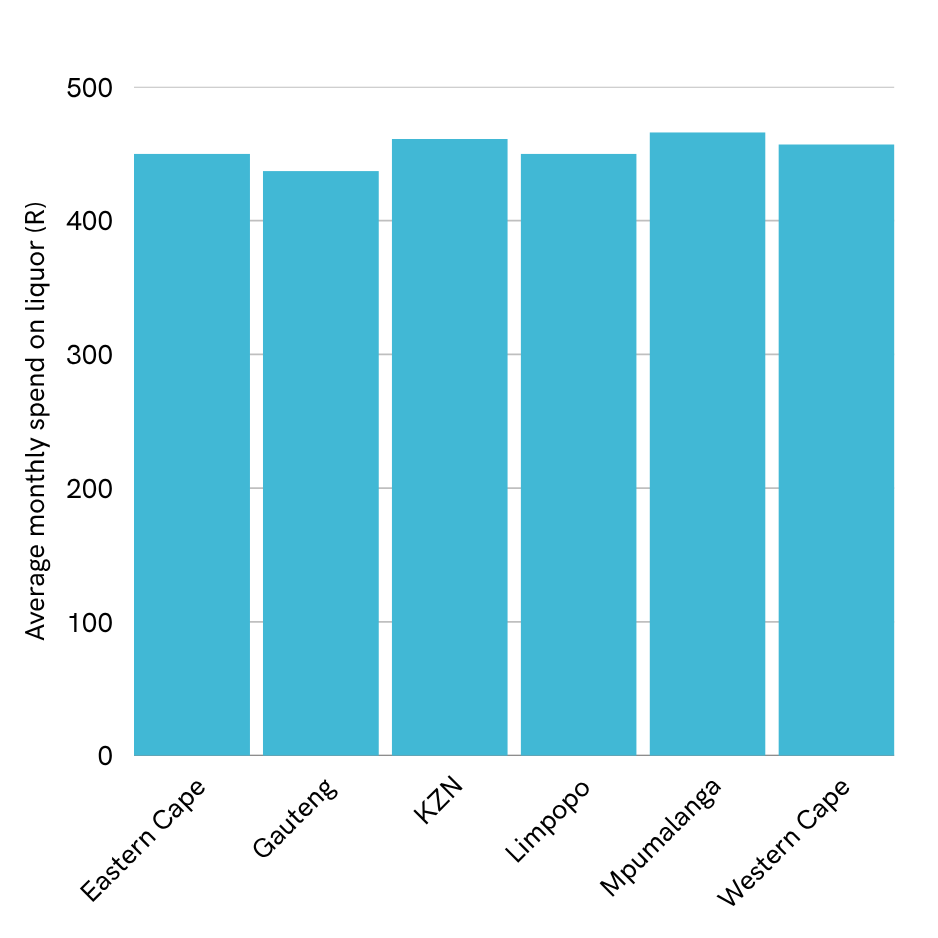
Controlling for income, spend per customer only varies modestly by province. Per person spending is highest in Mpumalanga and lowest in Gauteng.
Liquor spend per customer, by month

Average monthly liquor spend by income, controlling for age (26–35)
Average monthly liquor spend by age, controlling for income (R5–15kpm)
Average monthly liquor spend by province, controlling for income (R5–15kpm)
Cheers to the good times
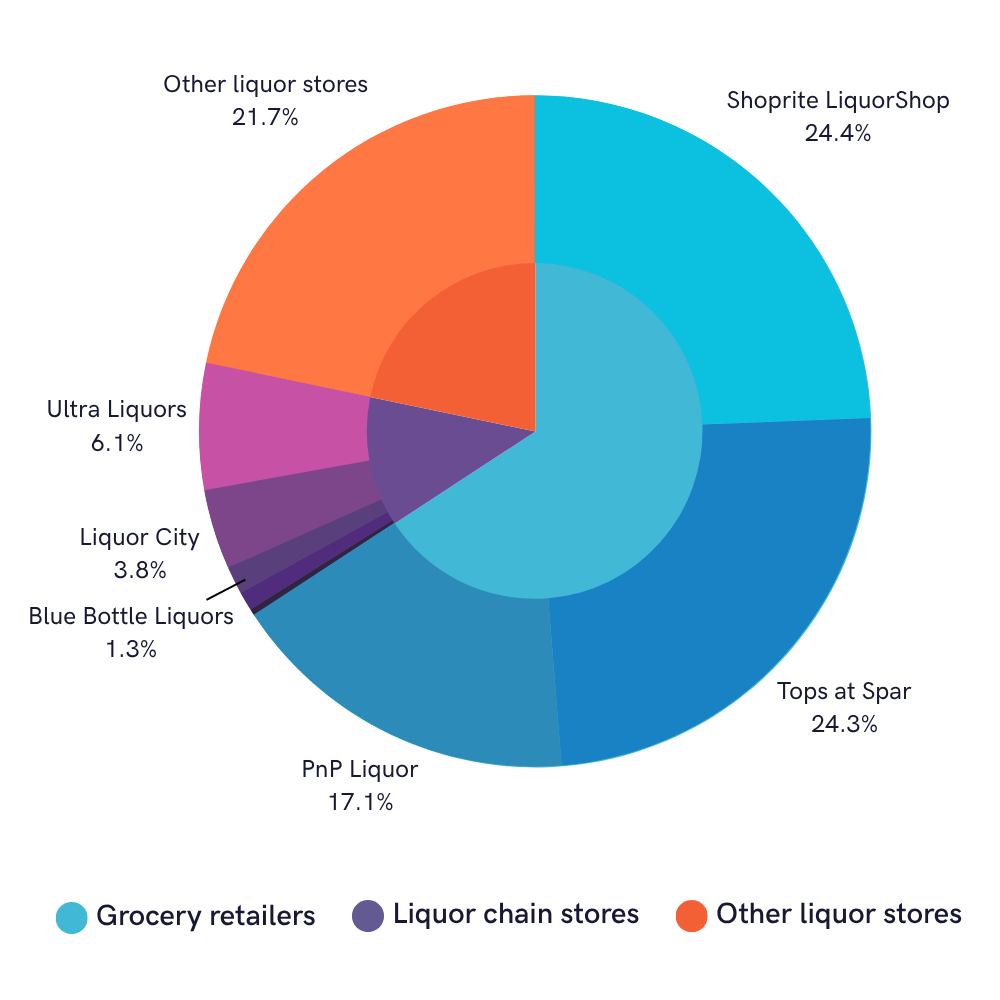
Let’s drill deeper into the specifics. For the rest of this analysis, we identified 700,000 liquor transactions in 4Q24 and split them into three groups:
- Grocery retailers (65% of total): Shoprite LiquorShop and Tops at SPAR;
- National chains (12% of total): Blue Bottle Liquors, Ultra Liquors etc;
- All others (remaining 23% of total): a large group of transactions that reference ‘bottle store’ or ‘liquor shop’ across South Africa.
Quick note: purchases from PnP Liquor are indistinguishable from purchases made at the adjoining PnP supermarket, and PnP Liquor is therefore invisible in our transaction data. It’s the same for Boxer.
However, if we look at the reported liquor earnings for Shoprite Holdings Group and for SPAR Group Ltd, a consistent estimate of retail sales per liquor store per year emerges: R21m pa in 2024. This number allows us to estimate PnP’s total value of sales (~R11.4bn, based on the total number of stores) and the contribution to reported revenue (~R9.1bn, based on franchise and corporate store mix). On this basis, liquor accounts for roughly 12% of reported revenue for PnP Supermarkets, the division of the listed PnP Stores Ltd.
Contribution to total retailer spend by select liquor outlets
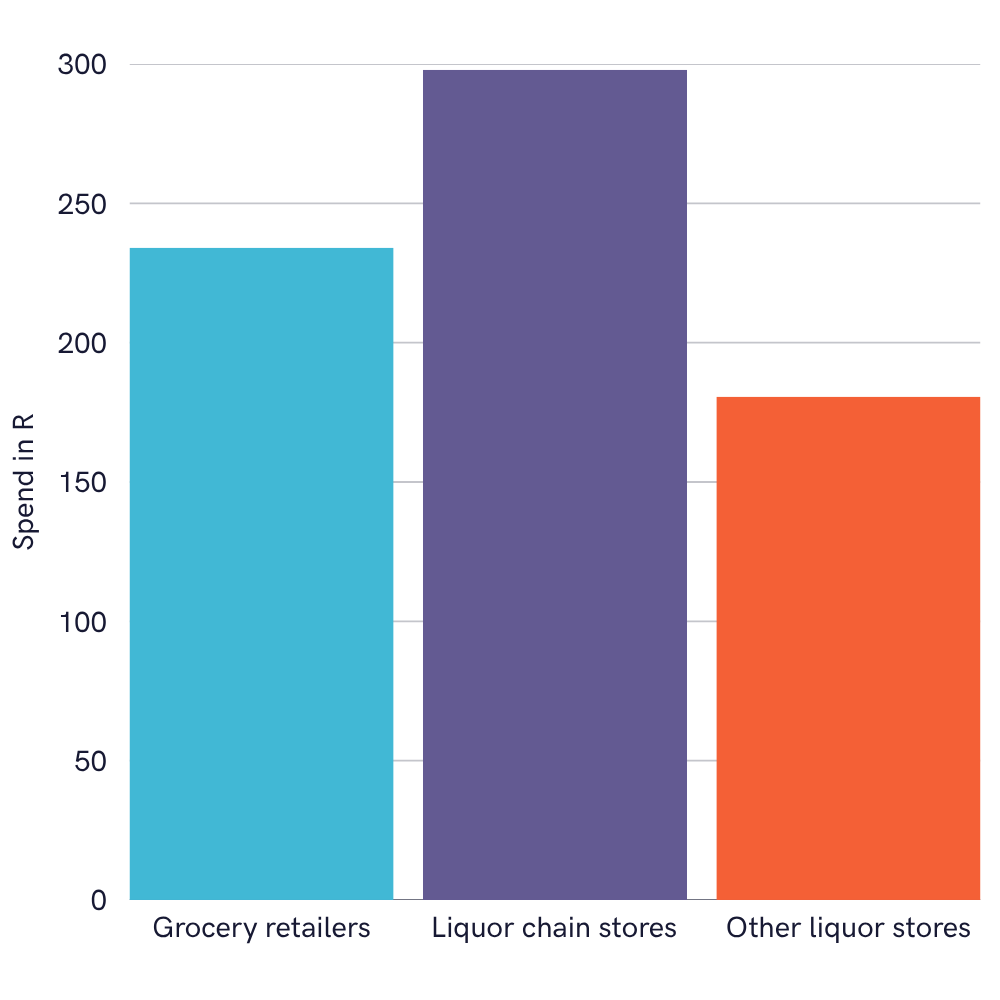
Underpinning this market share mix is a clear difference in how customers engage with stores within these different groups. We’ve highlighted the average transaction value (ATV) in each category, shown in the chart below. Customers shopping at chain stores like Ultra Liquors, Liquor City etc. have a higher ATV relative to those shopping at grocery retailers like Tops. ATV in the ‘Other liquor stores’ category is lower relative to Grocery.
From this, we can show that customers typically visit chain stores less often but they spend more each visit, whereas customers visit smaller independent stores more often and spend less each visit.
Average transaction value (ATV) by liquor category
Party on… But for how long?
On analyst calls, Shoprite regularly boasts about opening a new LiquorShop a week. Yes, the core component of the group’s liquor strategy over the past decade has clearly been growing its store footprint. This is a strategy of decreasing marginal benefits and it begs the question: Is it still optimal?
To assess the long-term viability of expanding store numbers, we analysed customer shopping habits to better understand the intersection of spending between the different liquor store formats.
You need to be logged in to read further.
If you are a client, please reset your password and login using your corporate e-mail address.
Slant offers solutions for investors, corporates and data partners. Click the button below to get in touch and find out how our alternative data and class-leading research can help you.