

In Brief
- 35% of money paid to online betting companies is lost.
- Half of customers will lose 80% of what they spend; 14% will get more in payouts than what they put in.
- 830 million: the estimated number of digital transactions to fund customer accounts.
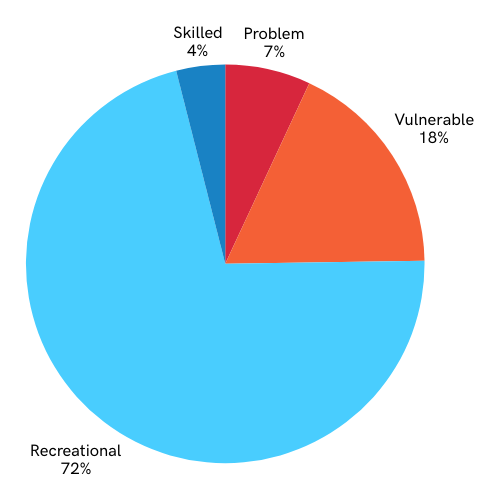
- 70% of bettors are considered ‘recreational’ – in the threshold of losing 2.5% and winning 5% of their income.
- 90% of money earned by online betting companies comes from just 7% of individuals in the sample.
Online betting is public enemy number one. Each week, there are media reports about the extraordinary growth of the industry over the last three years. CEOs of major consumer-facing companies are attributing their own underwhelming performance to the extractive nature of online betting on consumer income. And to top it all off, National Treasury recently proposed an additional 20% tax hike for betting companies.
To the best of our knowledge, nearly all information about the industry comes from official statistics published by the National Gambling Board. And those statistics are eye-opening…
The value of all bets in the betting sub-category – the one that includes all the brands currently plastered over every monetizable surface – reached R1.1 trillion in the year to March 2025, an increase of 48% on the previous year.
Of this, Gross Gambling Revenue (GGR) from betting – the net cost of betting to consumers – increased to R52bn, up from ‘only’ R11bn back in 2021, and a 45% increase from 2024.
Notably, growth in betting has transformed the gambling industry. Before 2021, casinos accounted for 60+% of all betting spend. Four years later and that figure has dropped to 22%. It’s not so much that overall spending at casinos has declined over the period, rather that betting spend has grown so much faster than other categories in the sector.
As always, aggregate statistics for a market of this size mask the subtleties that we believe are valuable to investors and analysts who want to understand the companies likely to be most vulnerable to online betting over the next five years – and the companies most likely to benefit.
To paraphrase the introduction to the discussion document recently published by National Treasury: There should be no problem with recreational gamblers as they do not place any external cost on society. However, it is in the public interests to regulate or reduce pathological or problem gambling that imposes costs on society.
‘Problem’ and ‘pathological’ are not defined, but if that is indeed the objective, we think investors (and regulators) should better understand the extent of the specific issues at hand, which is a topic too complex for a single report. This is the first of what may be a series of reports tackling different questions related to online betting.
Our goal today is to estimate the share of bettors that the National Treasury and regulators may want to protect, and to expose some of the economics and KPIs of the online betting market from a consumer spending perspective.
Cashing bets
Online betting is a highly sophisticated and well-developed ecosystem. Customers have multiple options to get money into their accounts, and multiple options of taking money out.
The betting ecosystem
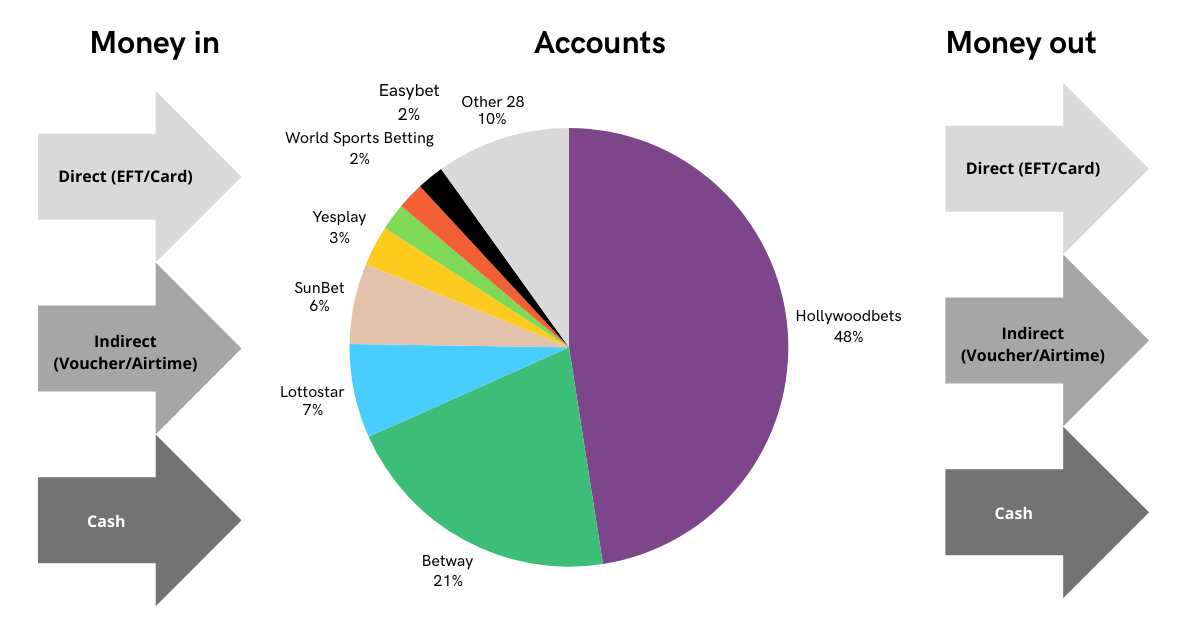
Punters can deposit money in a few ways: a direct deposit, by using a voucher from their bank or another issuer (via a Flash or Kazang device), or by handing over cash at a physical betting branch. These funds are then used to place bets. Successful bets are credited to the customer’s account and either used for another bet, paid out, or retained in the account. Payouts can be in the form of a voucher, prepaid airtime, or payment to a bank account or mobile wallet.
A bank statement view of the data captures most of these in- and outflows, but it’s most accurate when payments are made directly to an online betting company.
To increase the accuracy of our analysis, we need to be sure that we’re capturing a bettor’s complete transaction record of money paid to the betting companies, and money received. For example, the bettor who deposits cash at a physical branch to charge their account, and receives payouts electronically, would distort our findings.
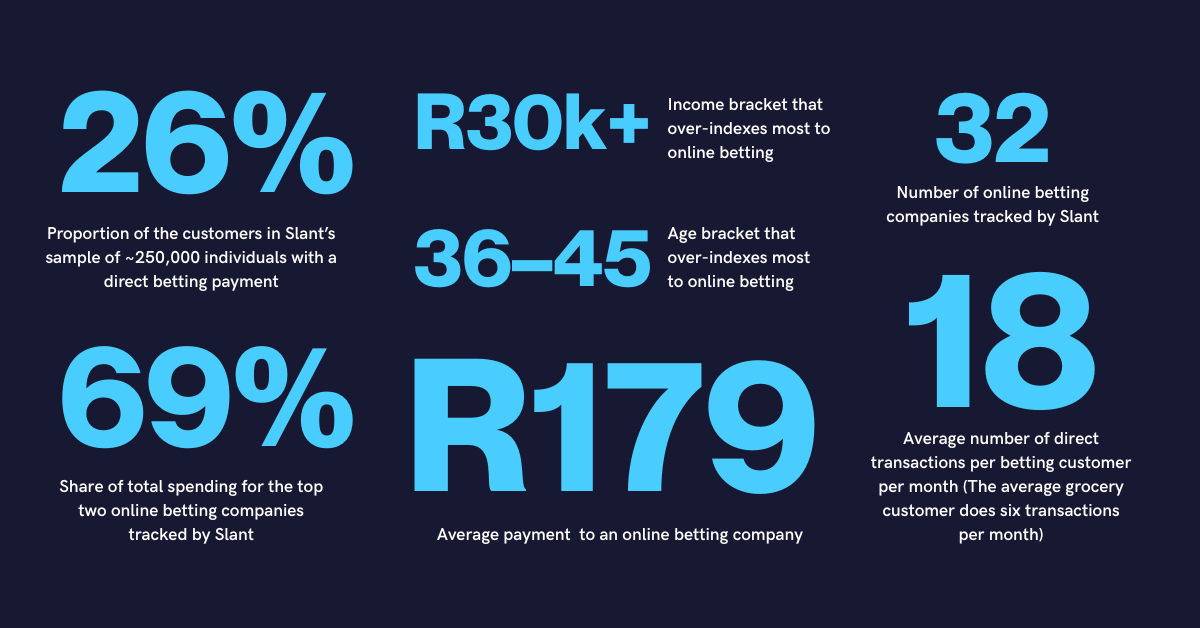
To reduce the risk of this, we restricted our customer sample to only include individuals with more than five direct payments to any of the 30+ online betting companies we track. Our thinking is that if a customer transacts frequently using directly payments on the expense side of the transaction, they’ll be more likely receive direct payments to their bank account for payouts.
To contextualise online betting in Slant’s data, here are a few key numbers:
Cash machines
Considering the segmentation of the data as described above, we then looked at customer activity over the four calendar quarters to September 2025. In each quarter, we isolated customers with complete transaction records for the quarter and identified all payments to and from the 32 online betting companies. In each quarter, we identified 9,700 -13,000 individual customers.
Let’s start with the net outcome.
For the customers identified in each quarter, the total value of spend – money paid to online betting companies – is ~35% less on average than the value of payments received by these same customers from the same companies. In other words, our best estimate is that 35c of each rand paid directly to online betting companies is lost.
Direct betting: customer’s account
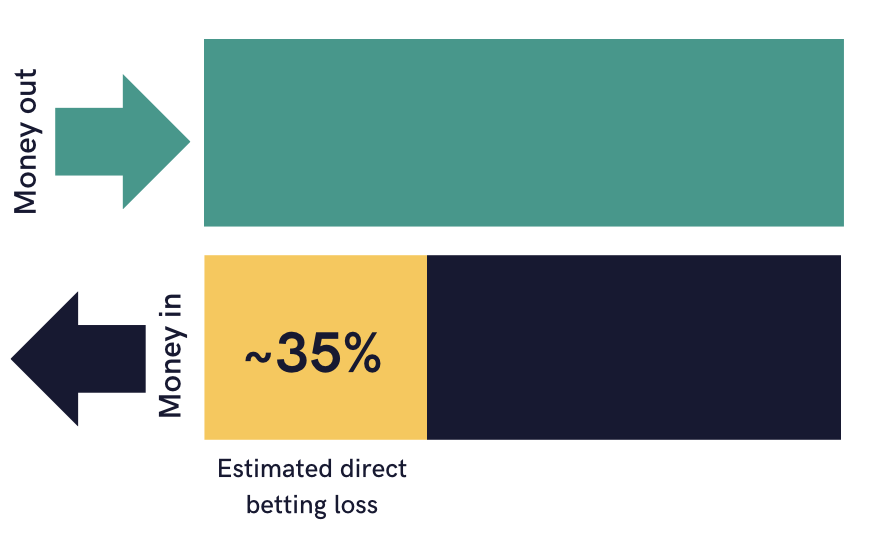
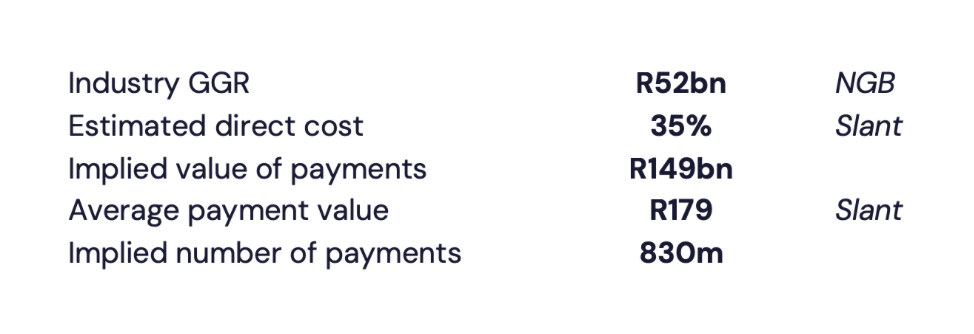
Net direct betting loss is the corollary of Gross Gambling Revenue (GGR). If Slant’s estimated direct betting loss is accurate, and assuming all betting accounts are funded by direct payment, then a net betting loss of 35% implies total cash payments to the betting industry of ~R148bn ( R52bn GGR divided by 35%).
The average online betting payment in our data is R179, which implies a total of 830 million transactions processed by the banks each year to enable the industry.
Note that in practice, the transactions above will be split between direct payments, VAS purchases, mobile wallet transfers and cash withdrawals – not only the direct payments that are the focus of our analysis. Still, banks charge a fee for all these payments – another reminder that bank transaction revenue, and payment processing in general, are the secondary beneficiaries of the online betting industry.
(Note: Some customers might have positive balances in their online betting accounts, which would mean that our ~35% loss is an overestimate. At a ~30% net direct betting loss, the total cash payment figure climbs to R173bn and total transactions increase to 967 million.)
Hotel California…
The 35% estimated direct betting loss is a key value in our analysis. Importantly, there’s a distribution around this estimate: some customers win and others lose it all. This is what we show in the next chart. In short: one in two bettors lose more than 80% of the money they put into their account; 70% lose half of the money they put in; and 14% of bettors receive more money back than they put in.
Distribution of individual bettors by net expense bracket
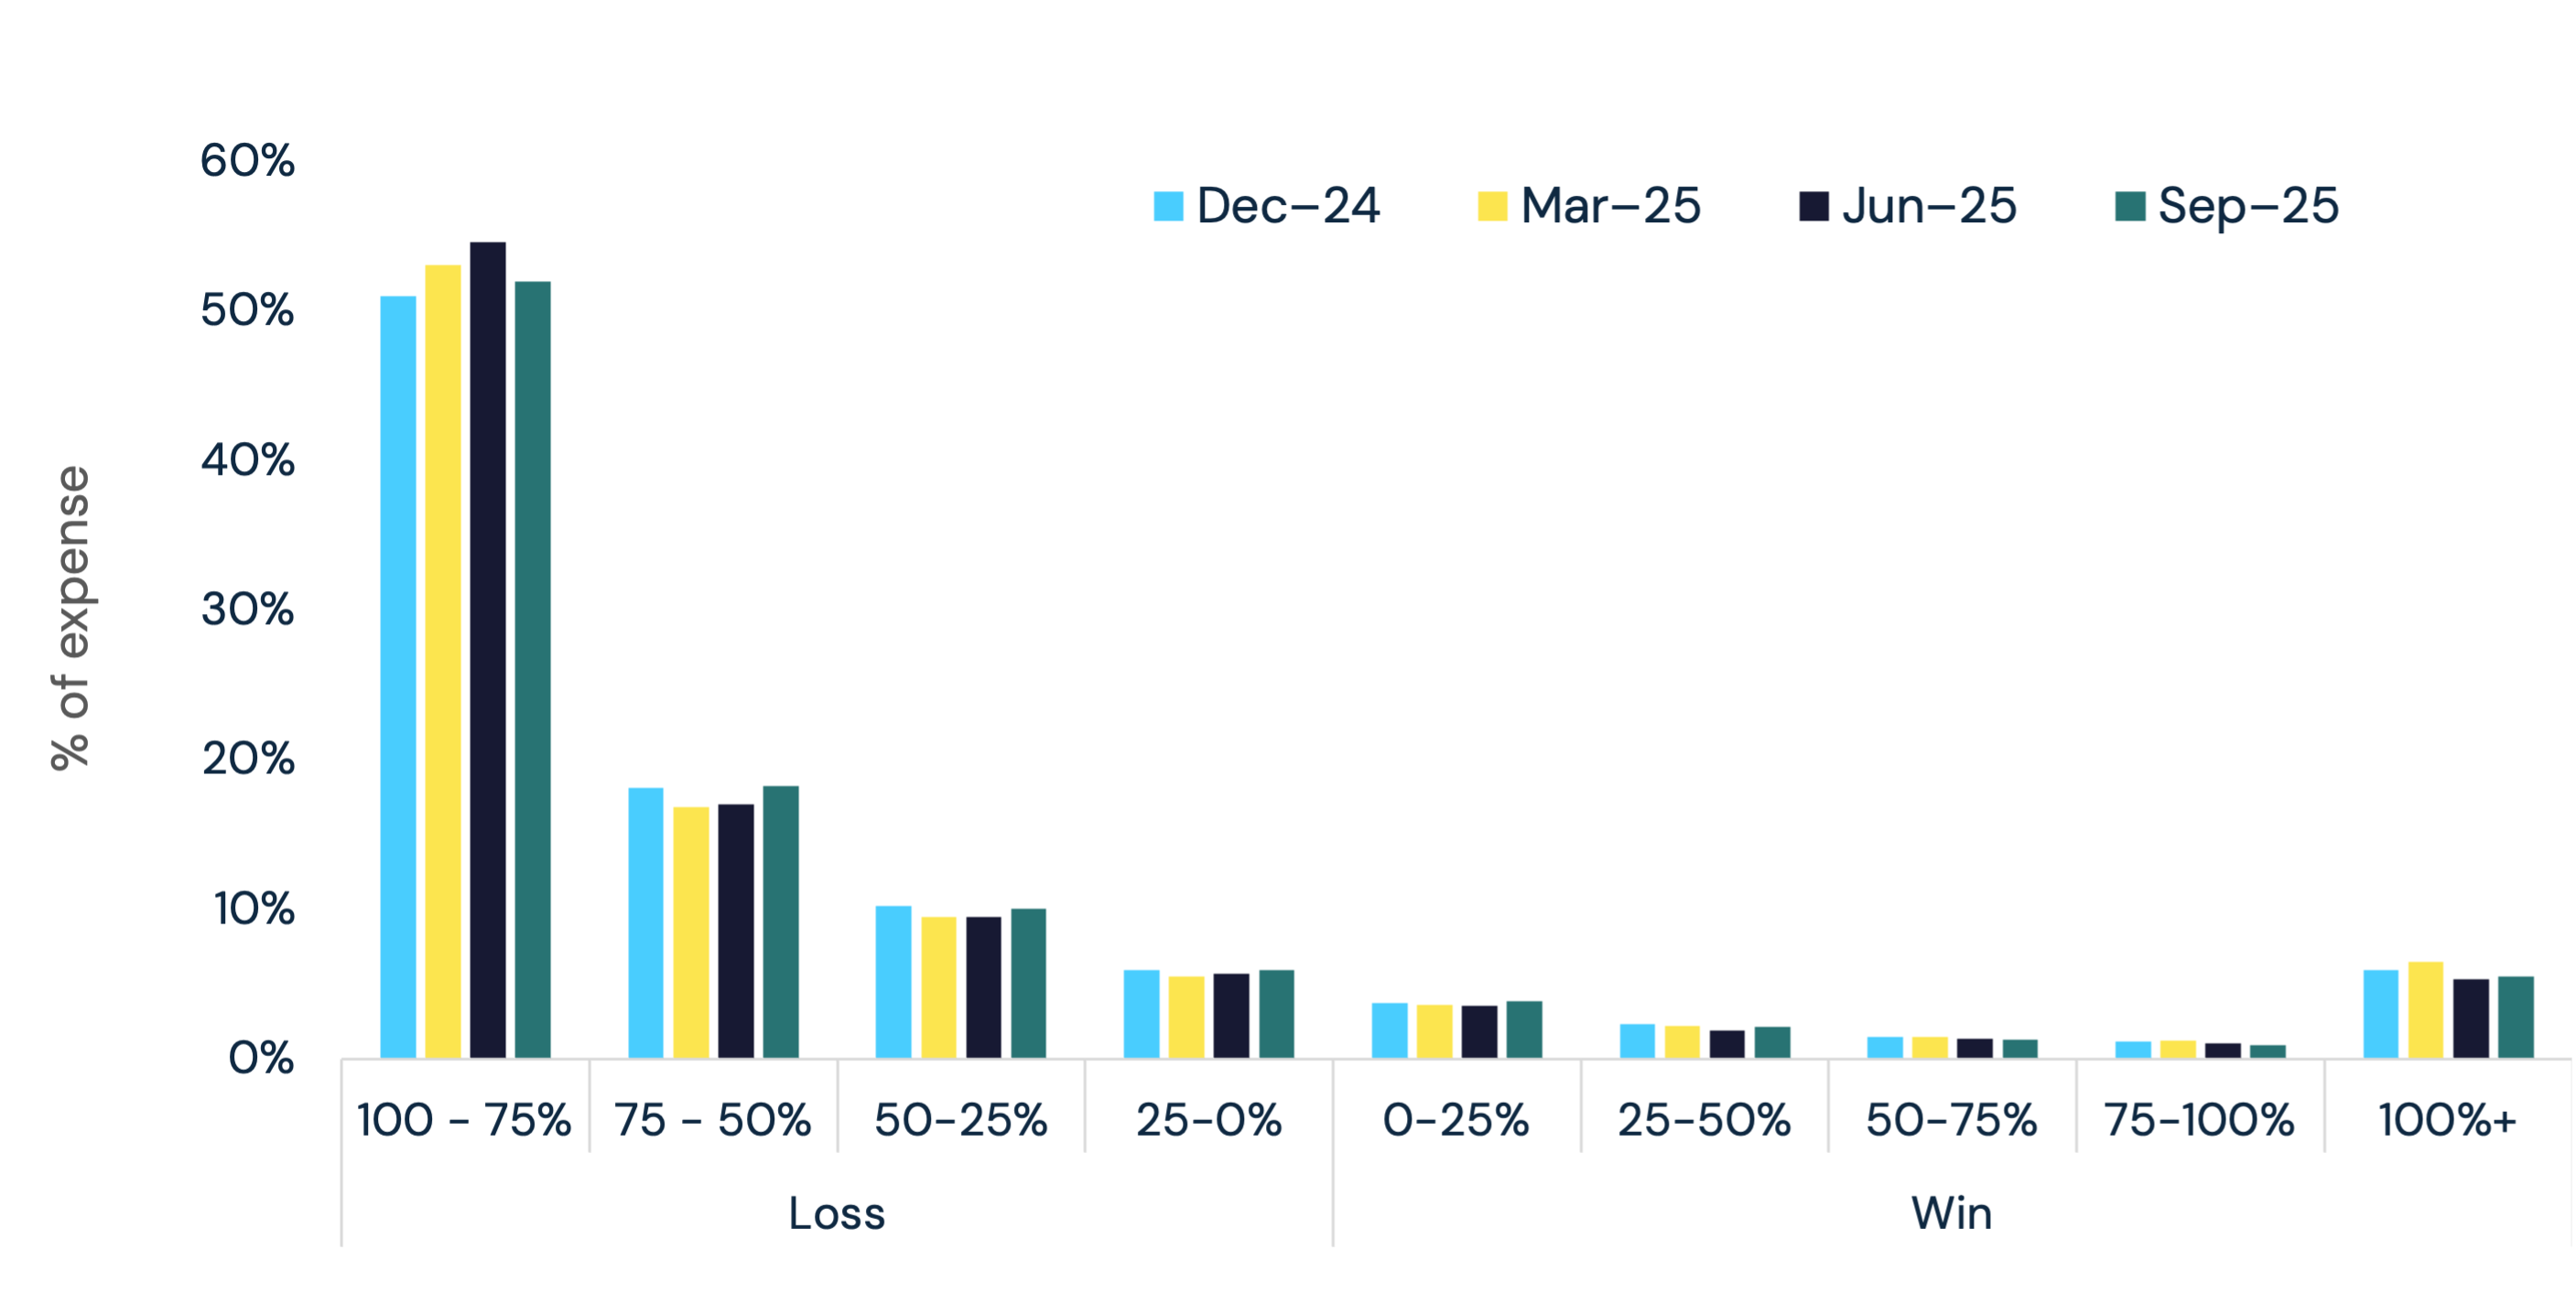
This shouldn’t be a surprise – online betting is entertainment. Saying that most people lose money betting online is like saying that most people lose money going to the cinema. Engaging with the entertainment is an expense.
The real issue is the context of the loss, not the loss itself. In other words, how much of each bettor’s personal resources are they putting at risk? After all, a R1,000 loss for someone who earns R5,000 per month is far more serious than it is to someone who earns R25,000.
There are lots of moving parts here and we need to understand each person’s expense tally in the context of their own income. Again, we turned to the transaction data…
In the next chart, we show the distribution of net direct betting expense to income ratio. Income is estimated based on a broad definition, including all inflows into each individual’s account, but ignoring transfers or common credits that are unlikely to be earnings-related (e.g. reversals and loan proceeds). We also ignore any betting income.
The chart shows that in each of the past four quarters, approximately 50% of individuals lost less that 2.5% of their monthly income; about 9% of individuals lost 2,5–5%, and so on…
Proportion of online bettors by net direct betting expense to income ratio
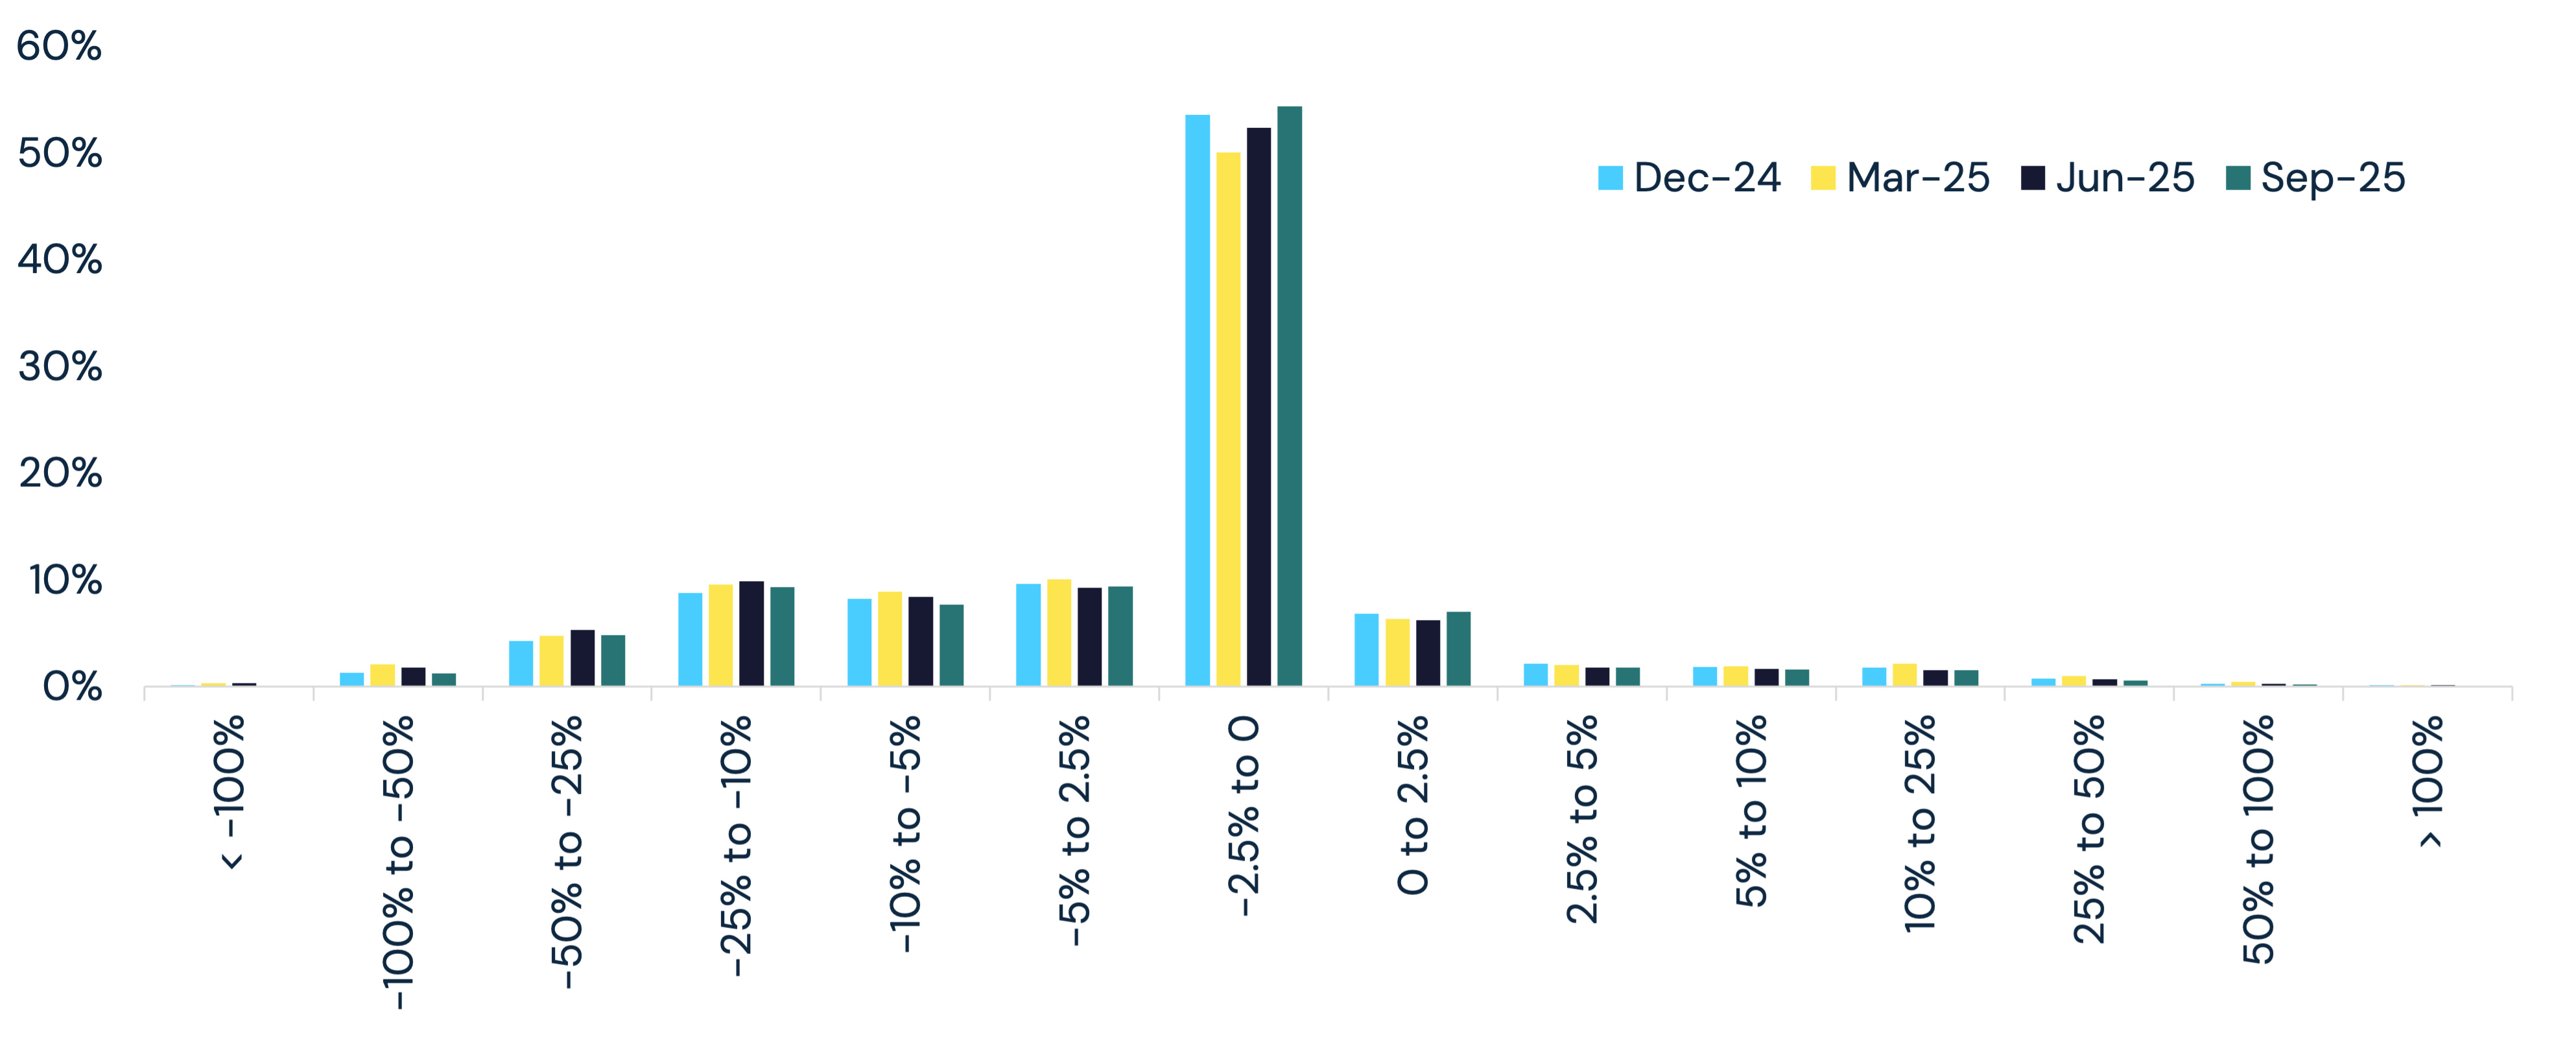
National Treasury is trying to address the externality of the betting problem – how pathological gambling negatively impacts society. But when is gambling a ‘problem’, and what is ‘pathological’? These qualitative questions risk leading us out of our analytical comfort zone, but we do believe that Treasury is concerned about the individuals on the left side of the distribution above.
To add some structure to our assessment of this issue, we defined four groups of customers based on the distribution of net direct betting expense to income ratio:
- Problem customers: those who lose more than 25% of their income. Individuals here are more likely to be placing extreme risks on their personal and household well-being.
- Vulnerable customers: those who lose 5–25% of their monthly income.
- Recreational customers: those who lose less than 5% of their income, or win less than 10% of their income.
LuckySkilled customers: those who win more than 10% of their income.
Based on these groups, here is the rough customer split:
(A word on outliers… Managing outliers in an analysis of online betting is much harder than, say, outliers affecting grocery spending. Extreme outcomes are to be expected in a betting market, but we’ve inspected them all and we believe they’re valid spending records. We have also validated the key results over different periods using different assumptions and larger sample sizes.)
The final element of our analysis is to attribute the net loss to the various customer groups.
The whale in the room
After defining customer groups as above, we assigned each of the ~11,000 individual bettors in each quarter to one of them. Doing so allowed us to aggregate the net expense for each group and compare it to the overall net expense of the whole sample. The results are sobering.
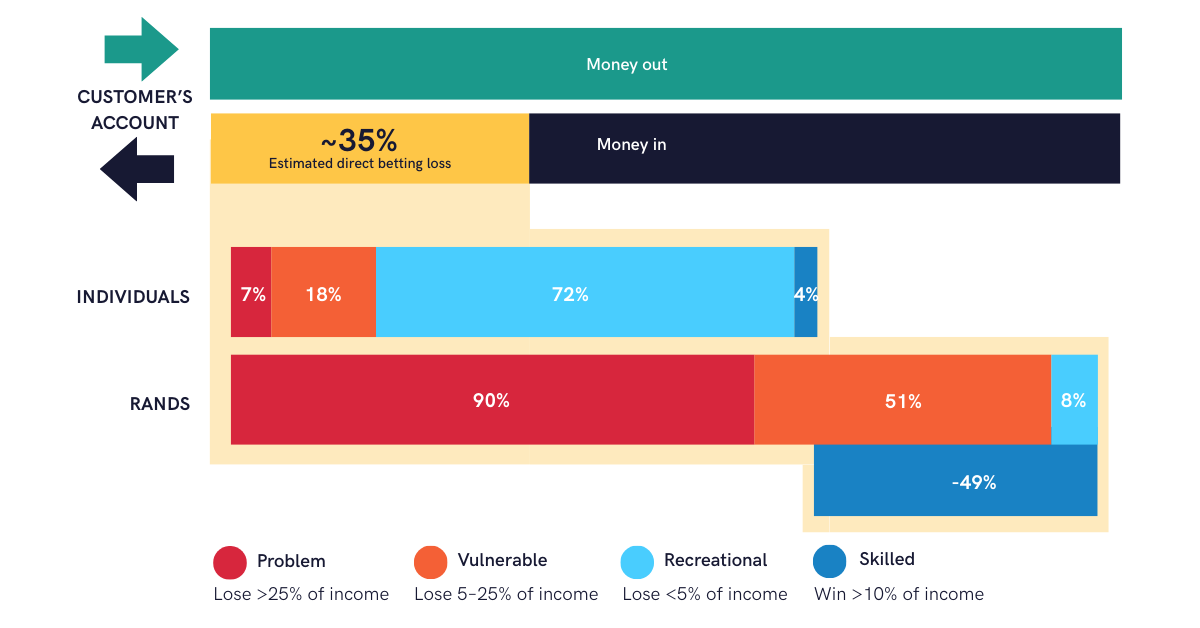
The 7% of individuals who fall into the Problem group of bettors in our data account for 90% of the total value of net direct betting loss, on average, over the four quarters of this analysis. In other words, Problem bettors are the game, because they account for nearly the entire loss experience by all customers. This loss is the betting companies’ revenue.
Vulnerable bettors – as per our definition – make up a further 51% of the net betting loss, which over the year of our analysis corresponds roughly to the gains paid to the Skilled group of bettors (-49%).
Tellingly, the 72% of Recreational bettors make up a modest 8% contribution of the total absolute net loss.
We expected the outcomes to be skewed, but not to this extent.
What now?
Our findings show a clear problem with a small segment of individuals losing extreme proportions of income. New regulations in the sector are inevitable, but understanding the shape of the problem will help analysts better predict the next steps and the knock-on effects.
Examples from other countries point to a combination of regulatory interventions (including income verification, betting limits and self-exclusion mechanisms) as the tools we can expect to be implemented locally. Simply hiking tax on its own is not likely to be effective.
We’ll leave you with two considerations in terms of timing and impact:
- When will interventions be implemented? Formalising new regulations is a slow progress. Conflict between provincial interests (some provinces receive a disproportionate share of gambling tax) and national interests may add additional friction to the process. In the interim, we expect the betting companies to aggressively grow participation, suggesting an increased headwind during the first half of 2026.
- Will these interventions make a difference? If a parallel can be drawn with the stringent import duties imposed on Shein and Temu towards the end of 2024, any regulations to suppress demand for online betting may be fleeting. As we have shown in previous reports, spending at the two Chinese retailers has recovered rapidly over the last few months. As always, some companies will be more impacted than others. The next report in this series will unpack how exposed each of the listed apparel retailers are to customers who bet online, and to each of the groups defined here.
Let us know what you think of this research, or if you have any other related topics you’d like Slant to explore.