

In our most recent research report , we showed just how difficult it is for physical gambling operators to compete for spend against online gambling sites. Spoiler: even the punters who visit casinos are increasing their spend online…
It’s probably no surprise, then, that the South African Bookmakers Association – established in 1951 and the country’s leading industry body representing members in the gambling industry – published a media release in early July outlining measures to combat illegal offshore gambling in SA.
In support of these measures, the group cites research they commissioned in late 2024: apparently illegal operators accounted for 62% of all online betting during the period; 16m South Africans engaged with illegal platforms; and R50bn in gross gambling revenue (GGR) was diverted offshore by illegal operators.
These are remarkable numbers, especially the last one, which more or less matches the value of legal online gambling. (For the year ending March 2025, the National Gambling Regulator stated that legal gambling sites generated GGR of R52bn.)
So, do bettors actually spend the same on illegal sites as they do on registered, legal online sites?
Helpfully for us, SABA published a list of 48 illegal operators, most registered in Curaçao and Malta. We used that list to mine for matching transactions in the Slant dataset.
Our Online Betting Dashboard tracks spending at 39 registered, legal operators. There were more than 3m transactions at those 39 operators during the first three months of 2026. That’s a lot of transactions! For context, during the same period, we identified 2.6m transactions across all the Grocery brands we track, and 0.5m transactions across all the Apparel brands we track. (The next sections highlight how representative many of these estimates are of these national retailers.)
So, how many transactions did we find that match any of the illegal operators flagged by SABA over the same period?
The answer: 48. Basically zero – not even noise. In fact, the vast majority of the flagged operators had no footprint in our data at all.
Now, it’s true that these operators might be presenting on client’s bank statements as something more innocent and generic. For example, ‘Slots of Vegas’ – one of the listed illegal operators – may come up as ‘Vegas Sports’ or ‘Vegas Supplies’; a strategy deployed by some brands to disguise the true nature of the expense.
However, Slant’s categorisation models are built on identifying recurring transaction patterns. If illegal sites were generating the level of engagement to support an aggregate nominal spending total on par with legal sites, we’d back ourselves to identify at least some of the brands.
If you don’t agree with us, perhaps Google search trends could help?
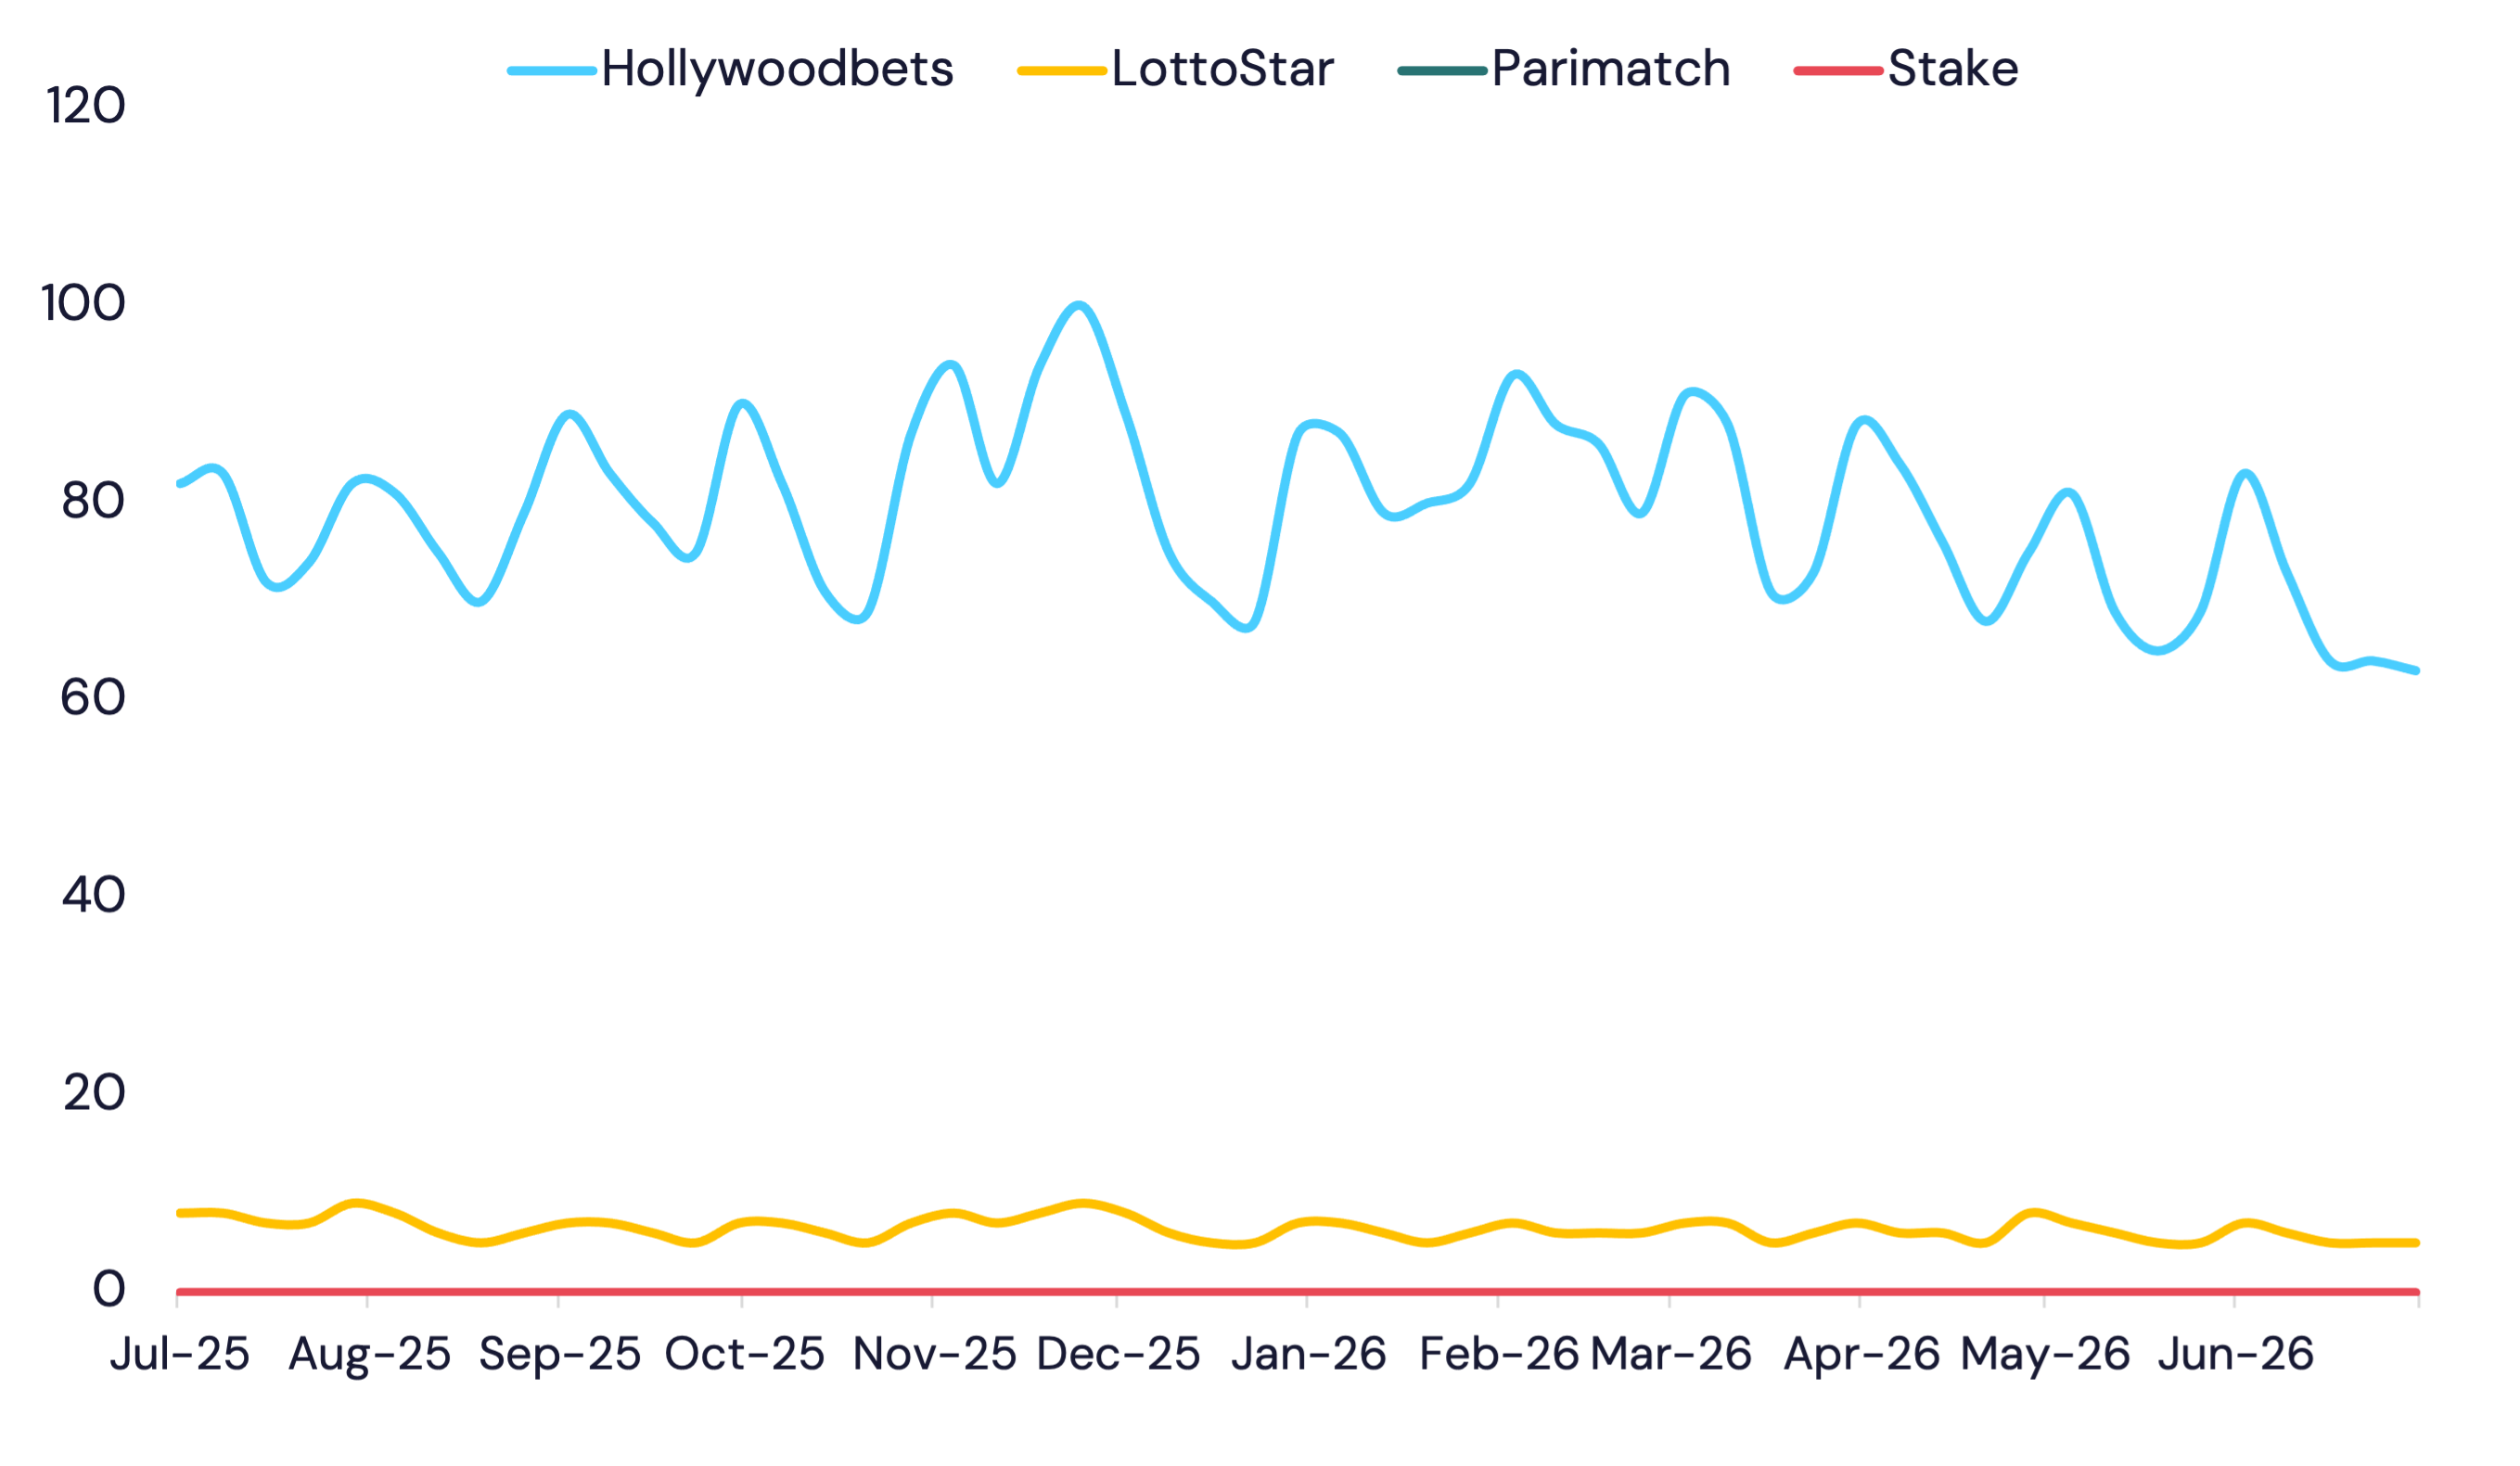
In the chart below, we reference search trends for two of the more recognisable illegal offshore brands – Stake (sponsor of Everton in the Premier League) and Parimatch (Chelsea sponsor) – and we compare those to searches for Hollywoodbets (#1 in our spending data) and LottoStar (#3).
Google presents search volumes by indexing all points to the highest point in the data: 100 = Hollywoodbets in late December 2025.
Search is arguably the leading source for consumers to discover and connect with online brands, and the Google data does indeed show robust search volumes for Hollywoodbets. Volumes for LottoStar are lower but also consistent.
In contrast, search volumes for Stake and Parimatch from South Africa are negligible. It’s inconceivable that a consumer company can attract the same value of spending as a large competitor without any trace of online search.
Google trends: Indexed search volumes in South Africa
Taking all of the above into account, and bringing some much-needed empirical data to an emotive topic, we’re not convinced by the quantum of spend that SABA claims is attributed to illegal online betting.
Trading updates incoming
A few listed retailers have already started updating investors on three- or six-month trading activity. More are expected over the next two weeks.
Instead of our traditional market share charts, we’re presenting the same data against reported sales growth numbers for the listed retailers. The objective is to show the relationship, and to help guide analyst expectations for sales growth momentum.
Apparel retailers: Reported results vs Slant growth estimates
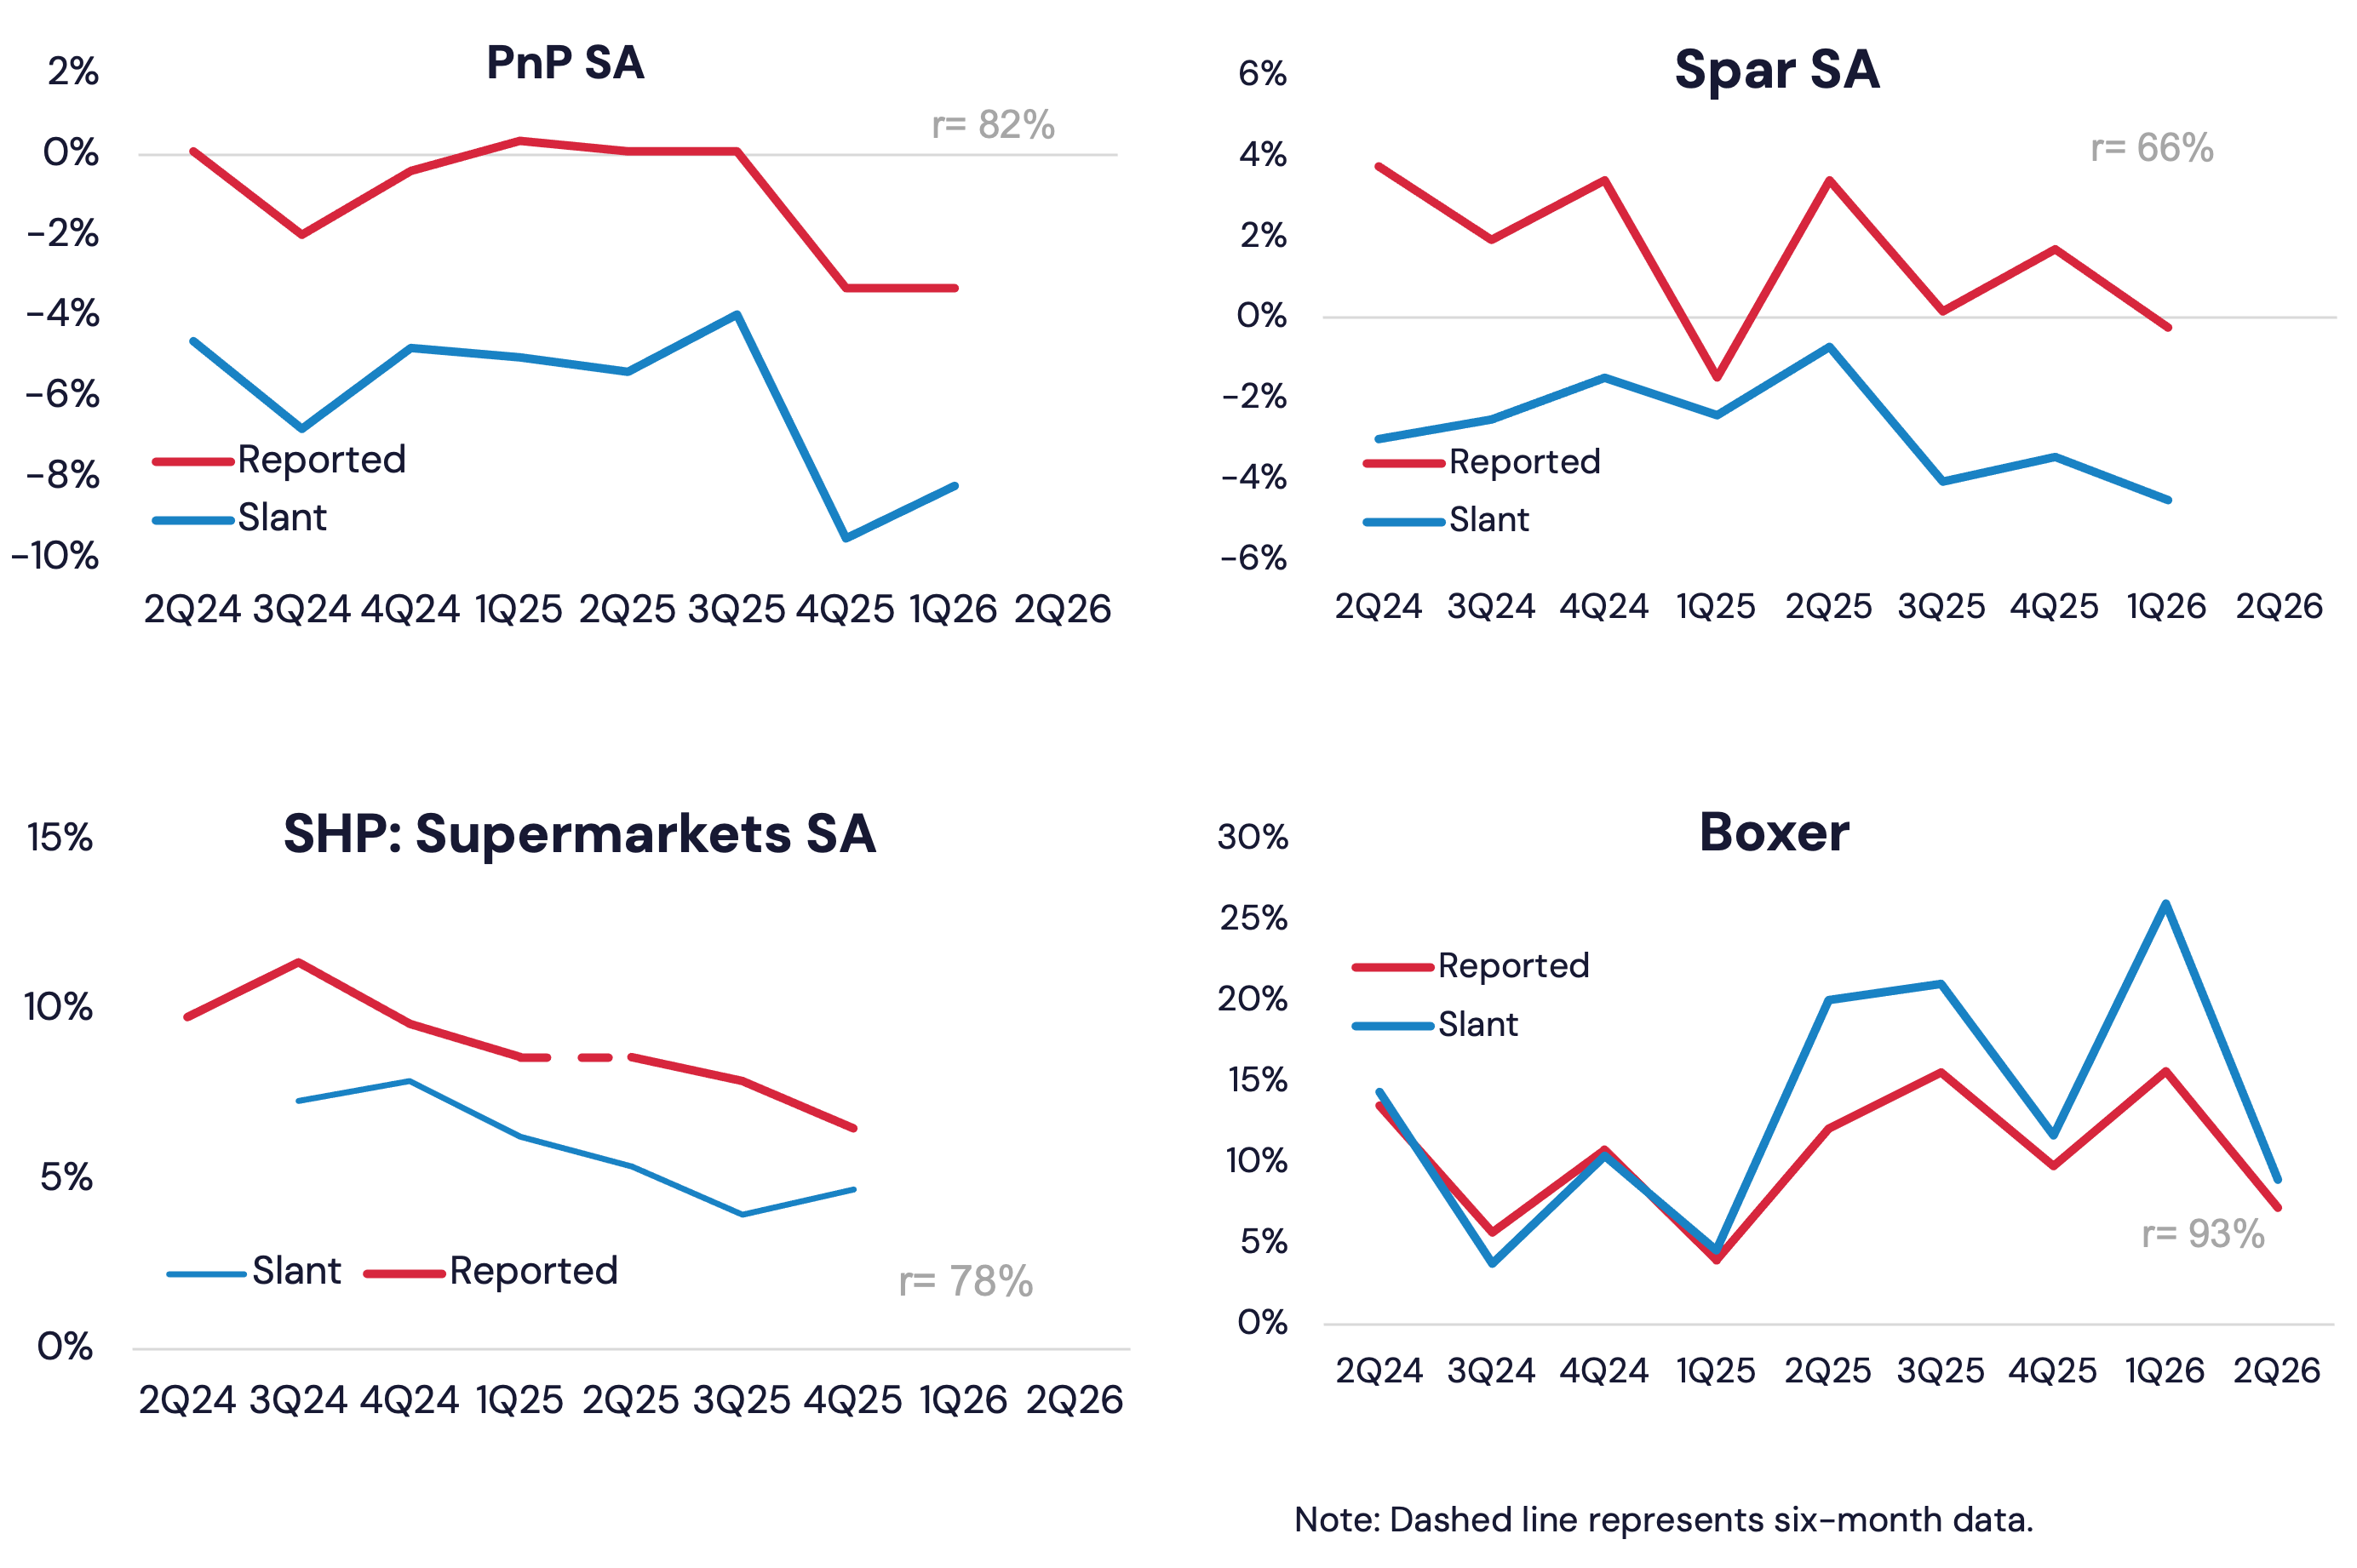
Overall, we note that the correlation between reported growth and Slant’s estimate has exceeded 75% in seven of the ten examples shown here – measured over seven quarters of reported growth – which is further evidence that our sample data is representative of the South African consumer.
Grocery retailers: Reported results vs Slant growth estimates
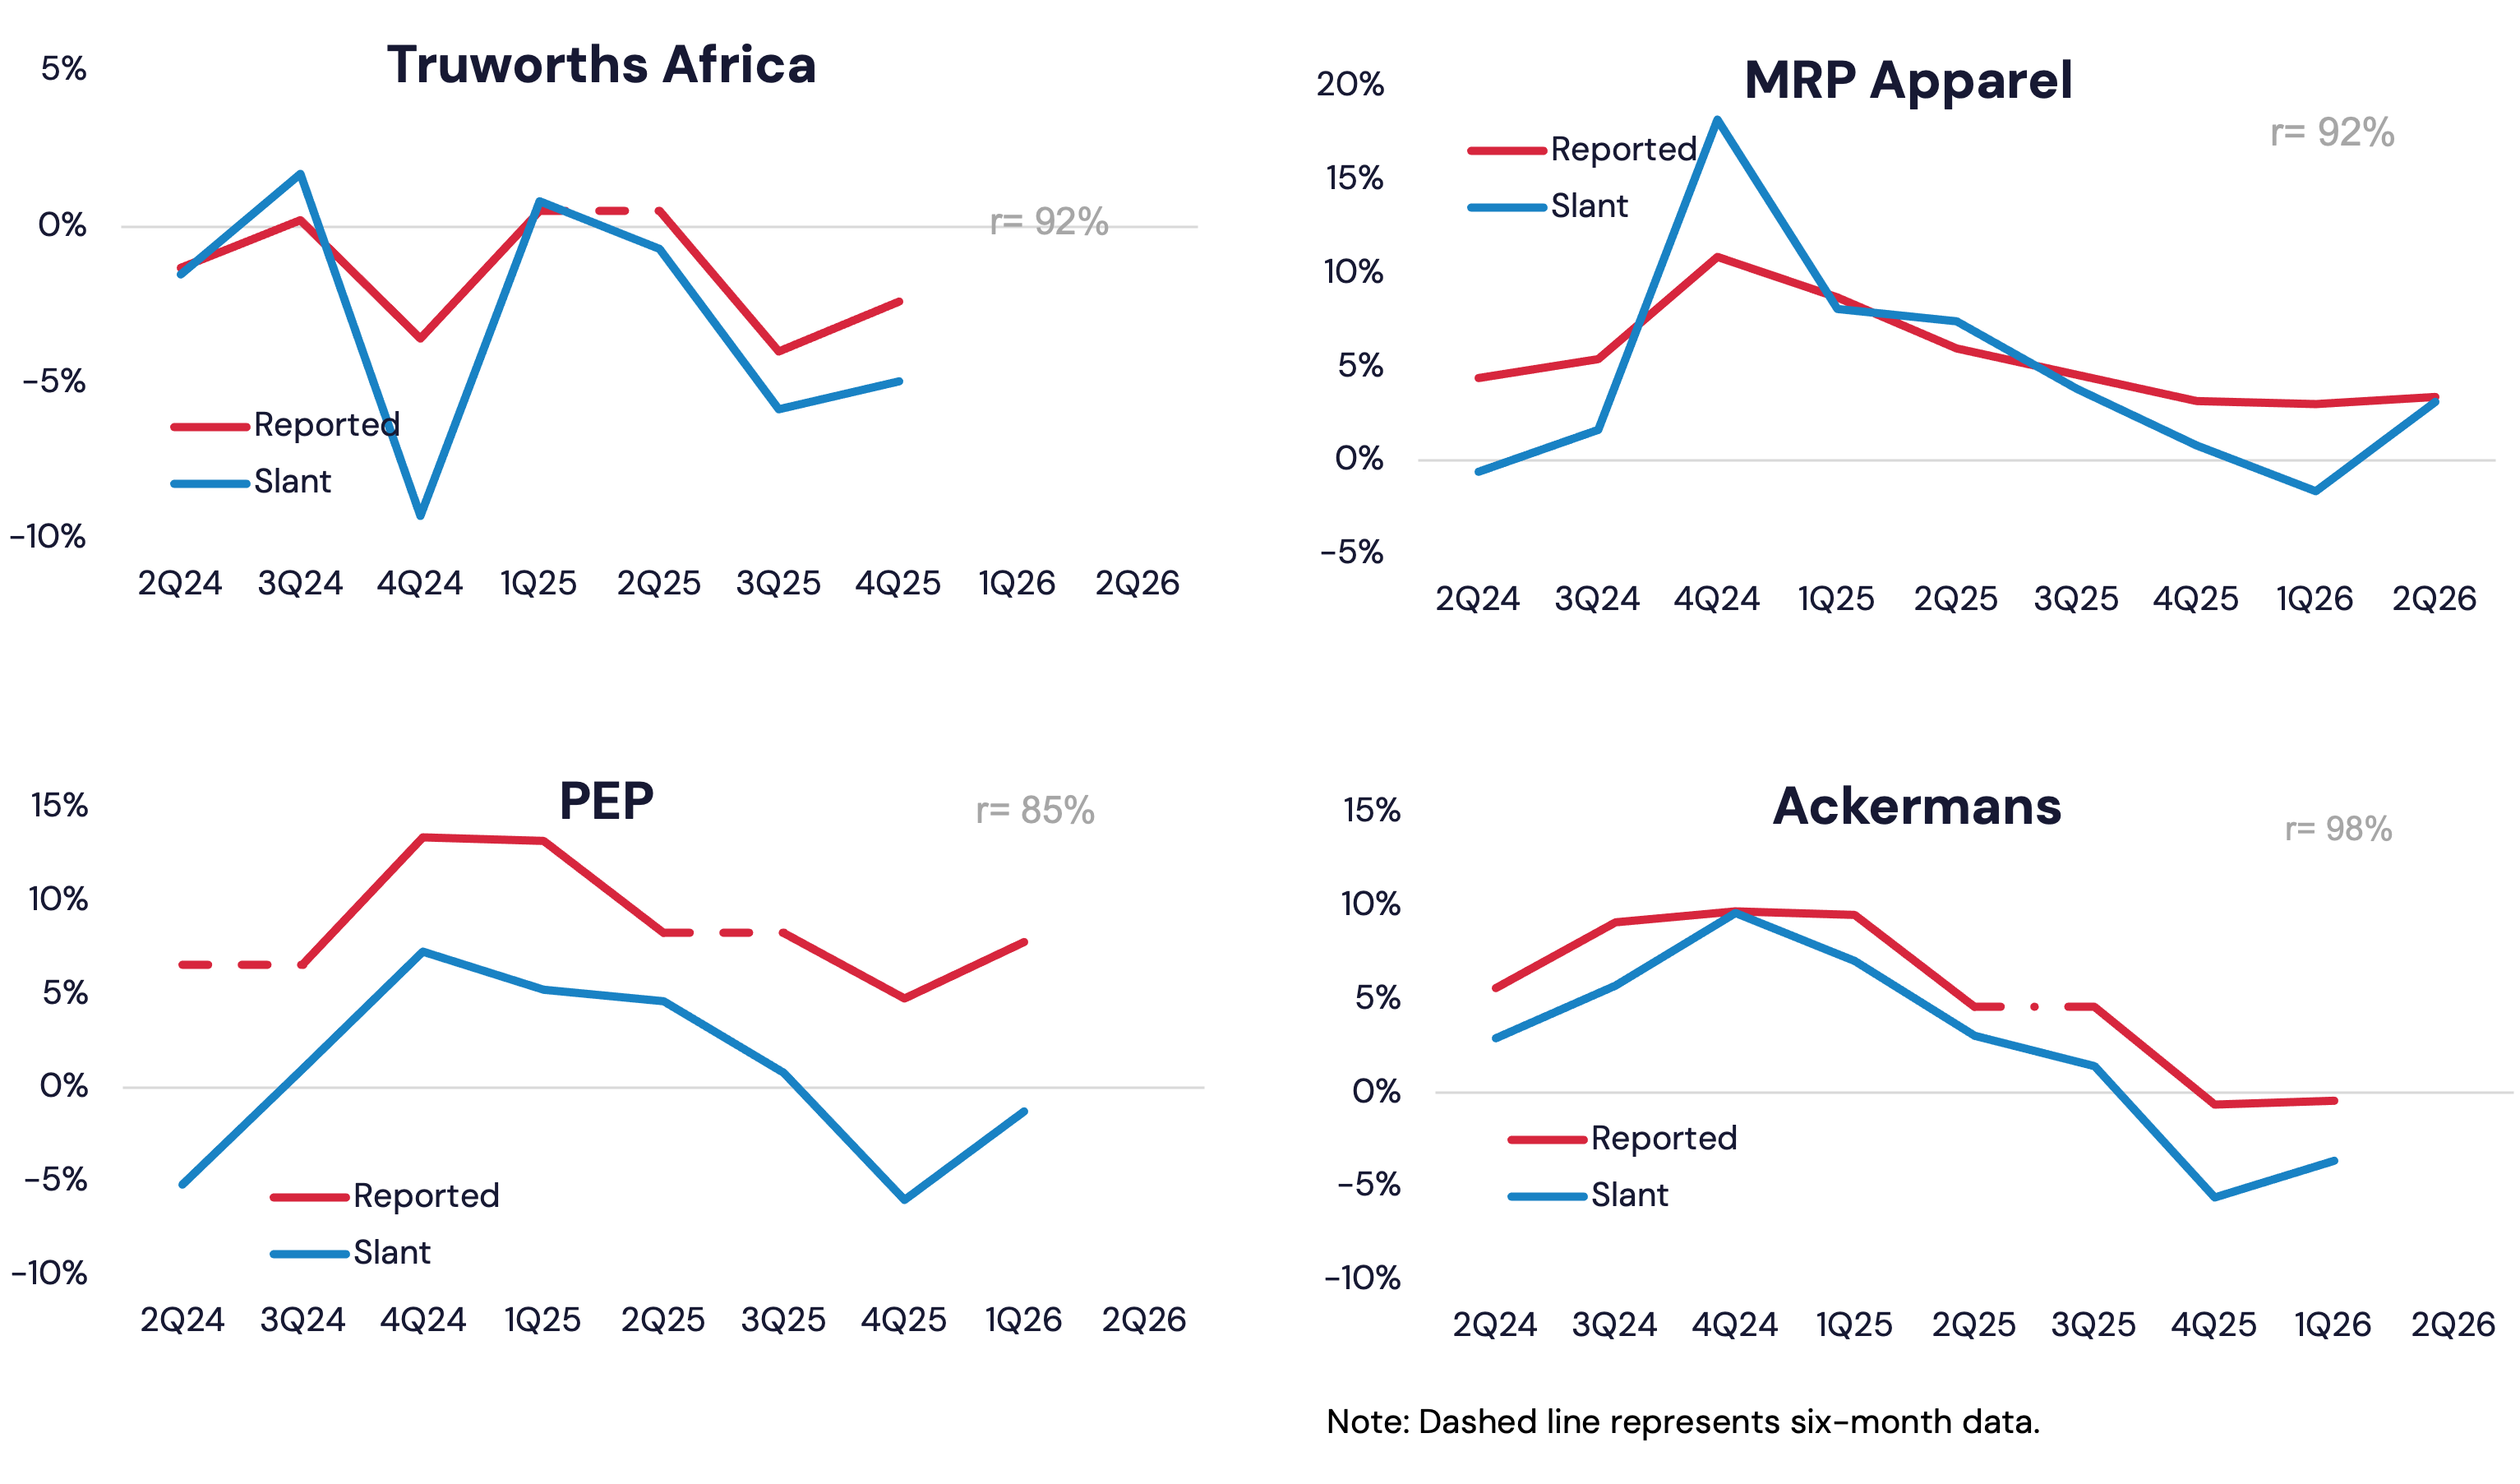
To be fair to our clients, we have masked the most recent data points. To receive the full version of Currents – with clear signals of unreported growth momentum – please contact us.