

For those of you who might still shop in-store for groceries, you’ve probably caught yourself scanning the trolleys of fellow shoppers and sorting them into different buckets: the homemaker, the student, the foodie, the carnivore… The alcoholic 🫣
These evaluations are not based on any single product, but rather on the combination of products in the basket.
At Slant, we can perform a similar exercise for hundreds of thousands of people at a time. Instead of looking in the basket at products, we look for associations between transactions.
What if we looked at transactions at apparel brands to find the relationships between brands that customers choose to buy? And what if we let the buckets be defined by the data and the maths, with limited bias introduced by us, the analysts?
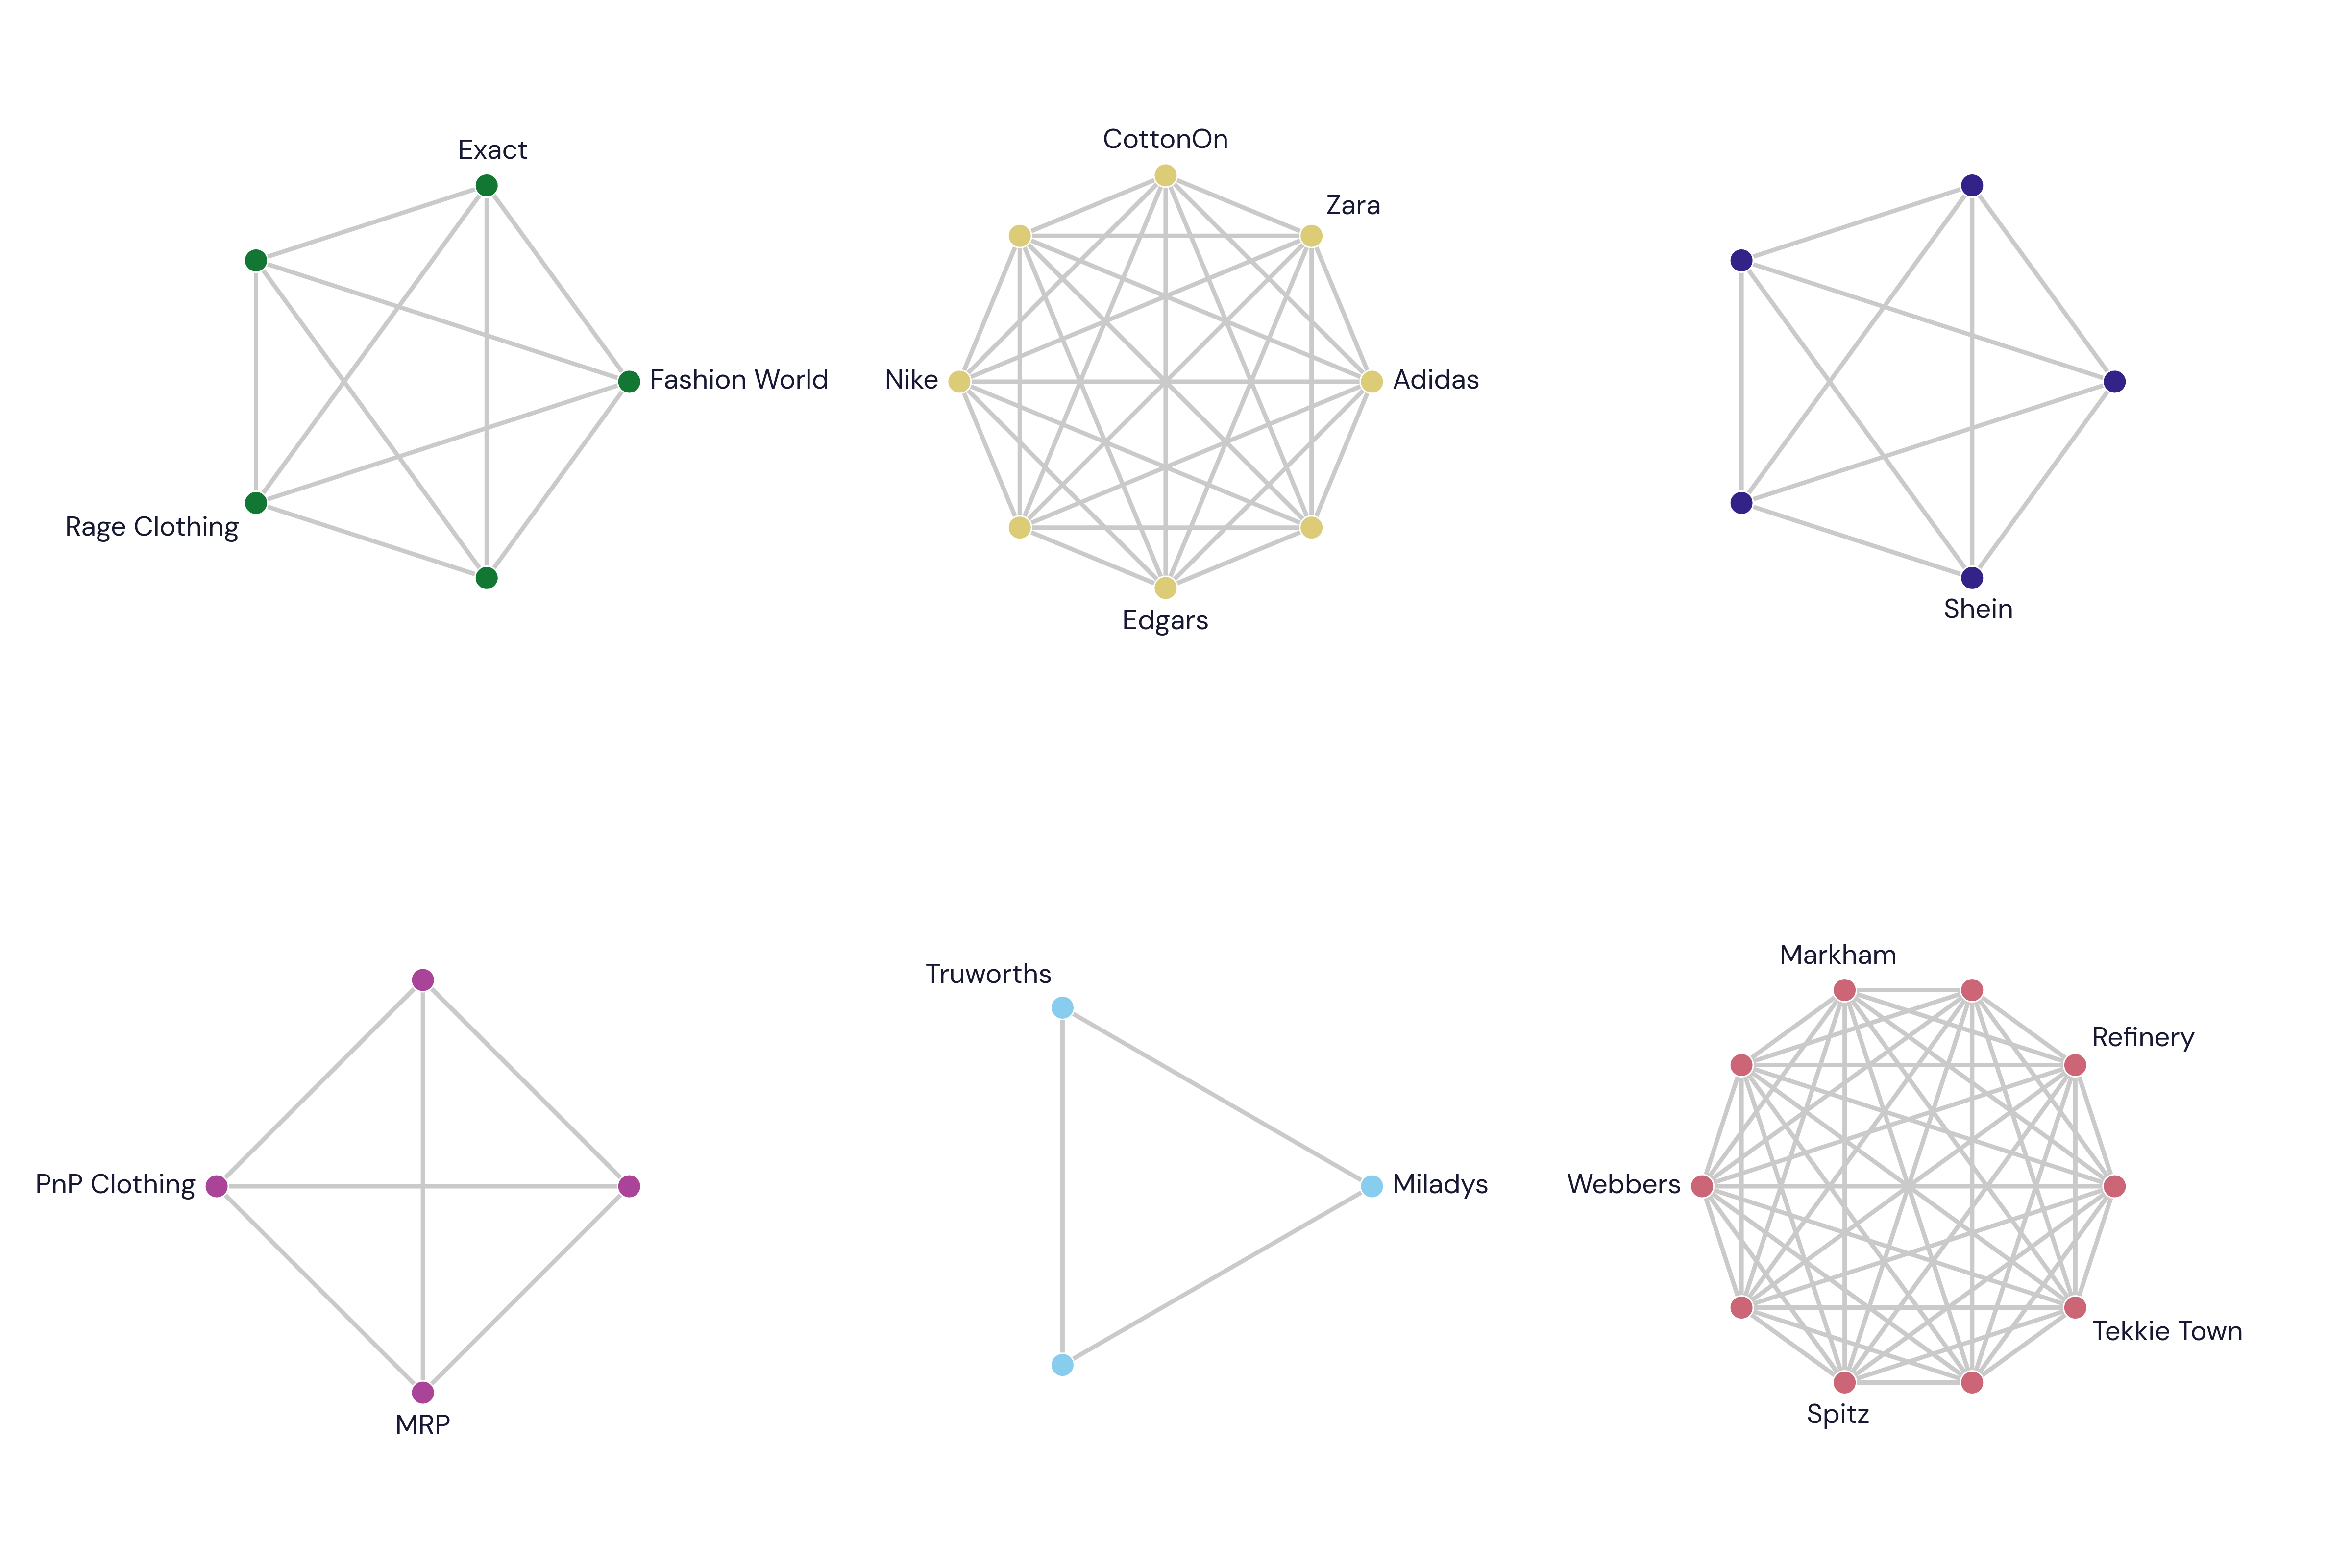
Each of the clusters below shows groups of brands that are most likely to be associated with each other, based entirely on individual customer purchases in our data.
Let’s start with the cluster at the top left. It includes brands like Rage, Exact, Fashion World and others that are more likely to be shopped together.
In contrast, the cluster top right includes Shein and the brands that Shein customers are also most likely to shop at. As our recent analysis shows, most of these brands gained market share over the same period as Shein did, suggesting that clusters represent complementary brands. (We have hidden the brands in question to be fair to paying clients – if you want the full report, get in touch and subscribe.)
The cluster in the middle of the top row includes many premium, fashion-focussed brands, while the cluster bottom right contains footwear and sports-orientated brands.
Cross-shopping apparel brands
Pretty visualisation, but what’s the point?
Well, in a crowded apparel market, this kind of information provides evidence of the real lines of competition. For example, the findings indicate that PnP Clothing competes more directly with MRP. If so, where do Ackermans and Jet sit?.
In turn, this understanding allows for deeper interrogation of company strategy. Do the listed retailers have brands that are complementary to Shein purchases? And if Miladys is the most similar brand to Truworths, should MRP be more assertive in extending credit to Miladys customers?
The data doesn’t lie. If you want to explore any of the relationships in more detail, please contact us.
Big pharma
Together, Clicks and Dis-Chem lay claim to more than 50% of the private dispensary market in South Africa. Add the other pharmacy sub-categories that they dominate – in some, market share can exceed 40% – and it’s not surprising that these two retailers account for 85% of Slant’s ‘Retail Pharmacy’ category.
A small part of the remaining 15% comes from Spar and Shoprite pharmacies, but most of the balance is accounted for by a plethora of independent pharmacies that have survived retail consolidation over the past 20 years.
We group these into a catch-all group called ‘Other Pharmacy’ on our Retail Pharmacy dashboard, which is now available via the Investor Portal.
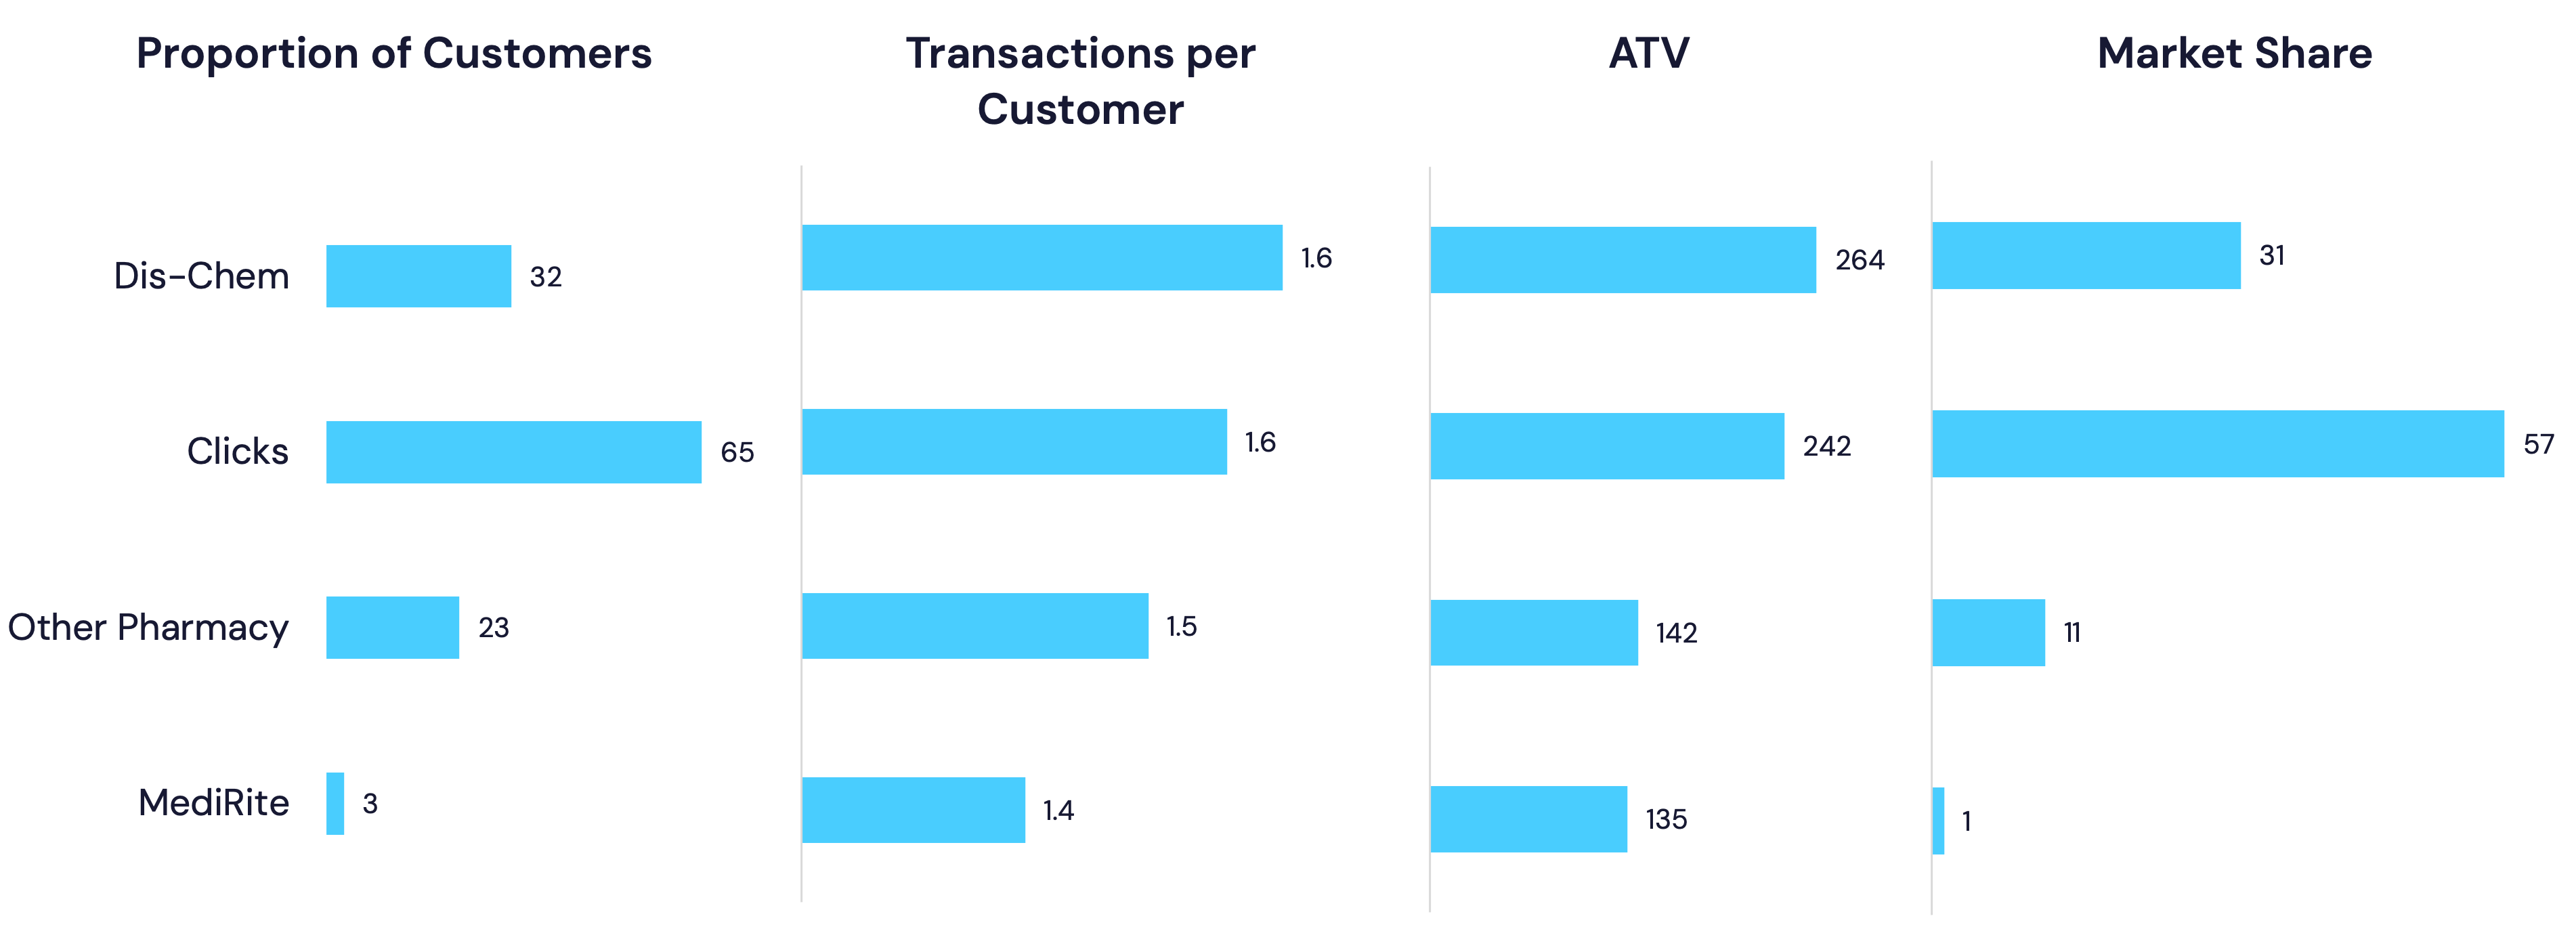
The following breakdown highlights notable differences in how customers engage with the various pharmacy retailers in South Africa. Transaction values at Dis-Chem and Clicks are ~75% higher than at Other Pharmacy and MediRite (Shoprite Holdings). Transaction frequency at the mega chains is also materially higher.
Combined, this explains why transactions at smaller pharmacies account for only R11 of every R100 spent, even though 23 out of every 100 customers may purchase from those outlets.
Build It and they will come
The ‘DIY and Hardware’ category is another new segment in the Investor Portal. Investor exposure to this category is via a handful of (now) small-cap retailers: Spar (Built It), Cashbuild, KAL Group (Agrimark) and Italtile.
In all, we’ve identified ~11 retail chains: the above, plus Mica, Brights, Chamberlain Hardware, Gelmar, Leroy Merlin and BUCO.
During the process of interrogating and cleaning the data, we observed a few interesting trends. The first is the provincial dispersion of retailers in this category…
Provincial spending split by retailer
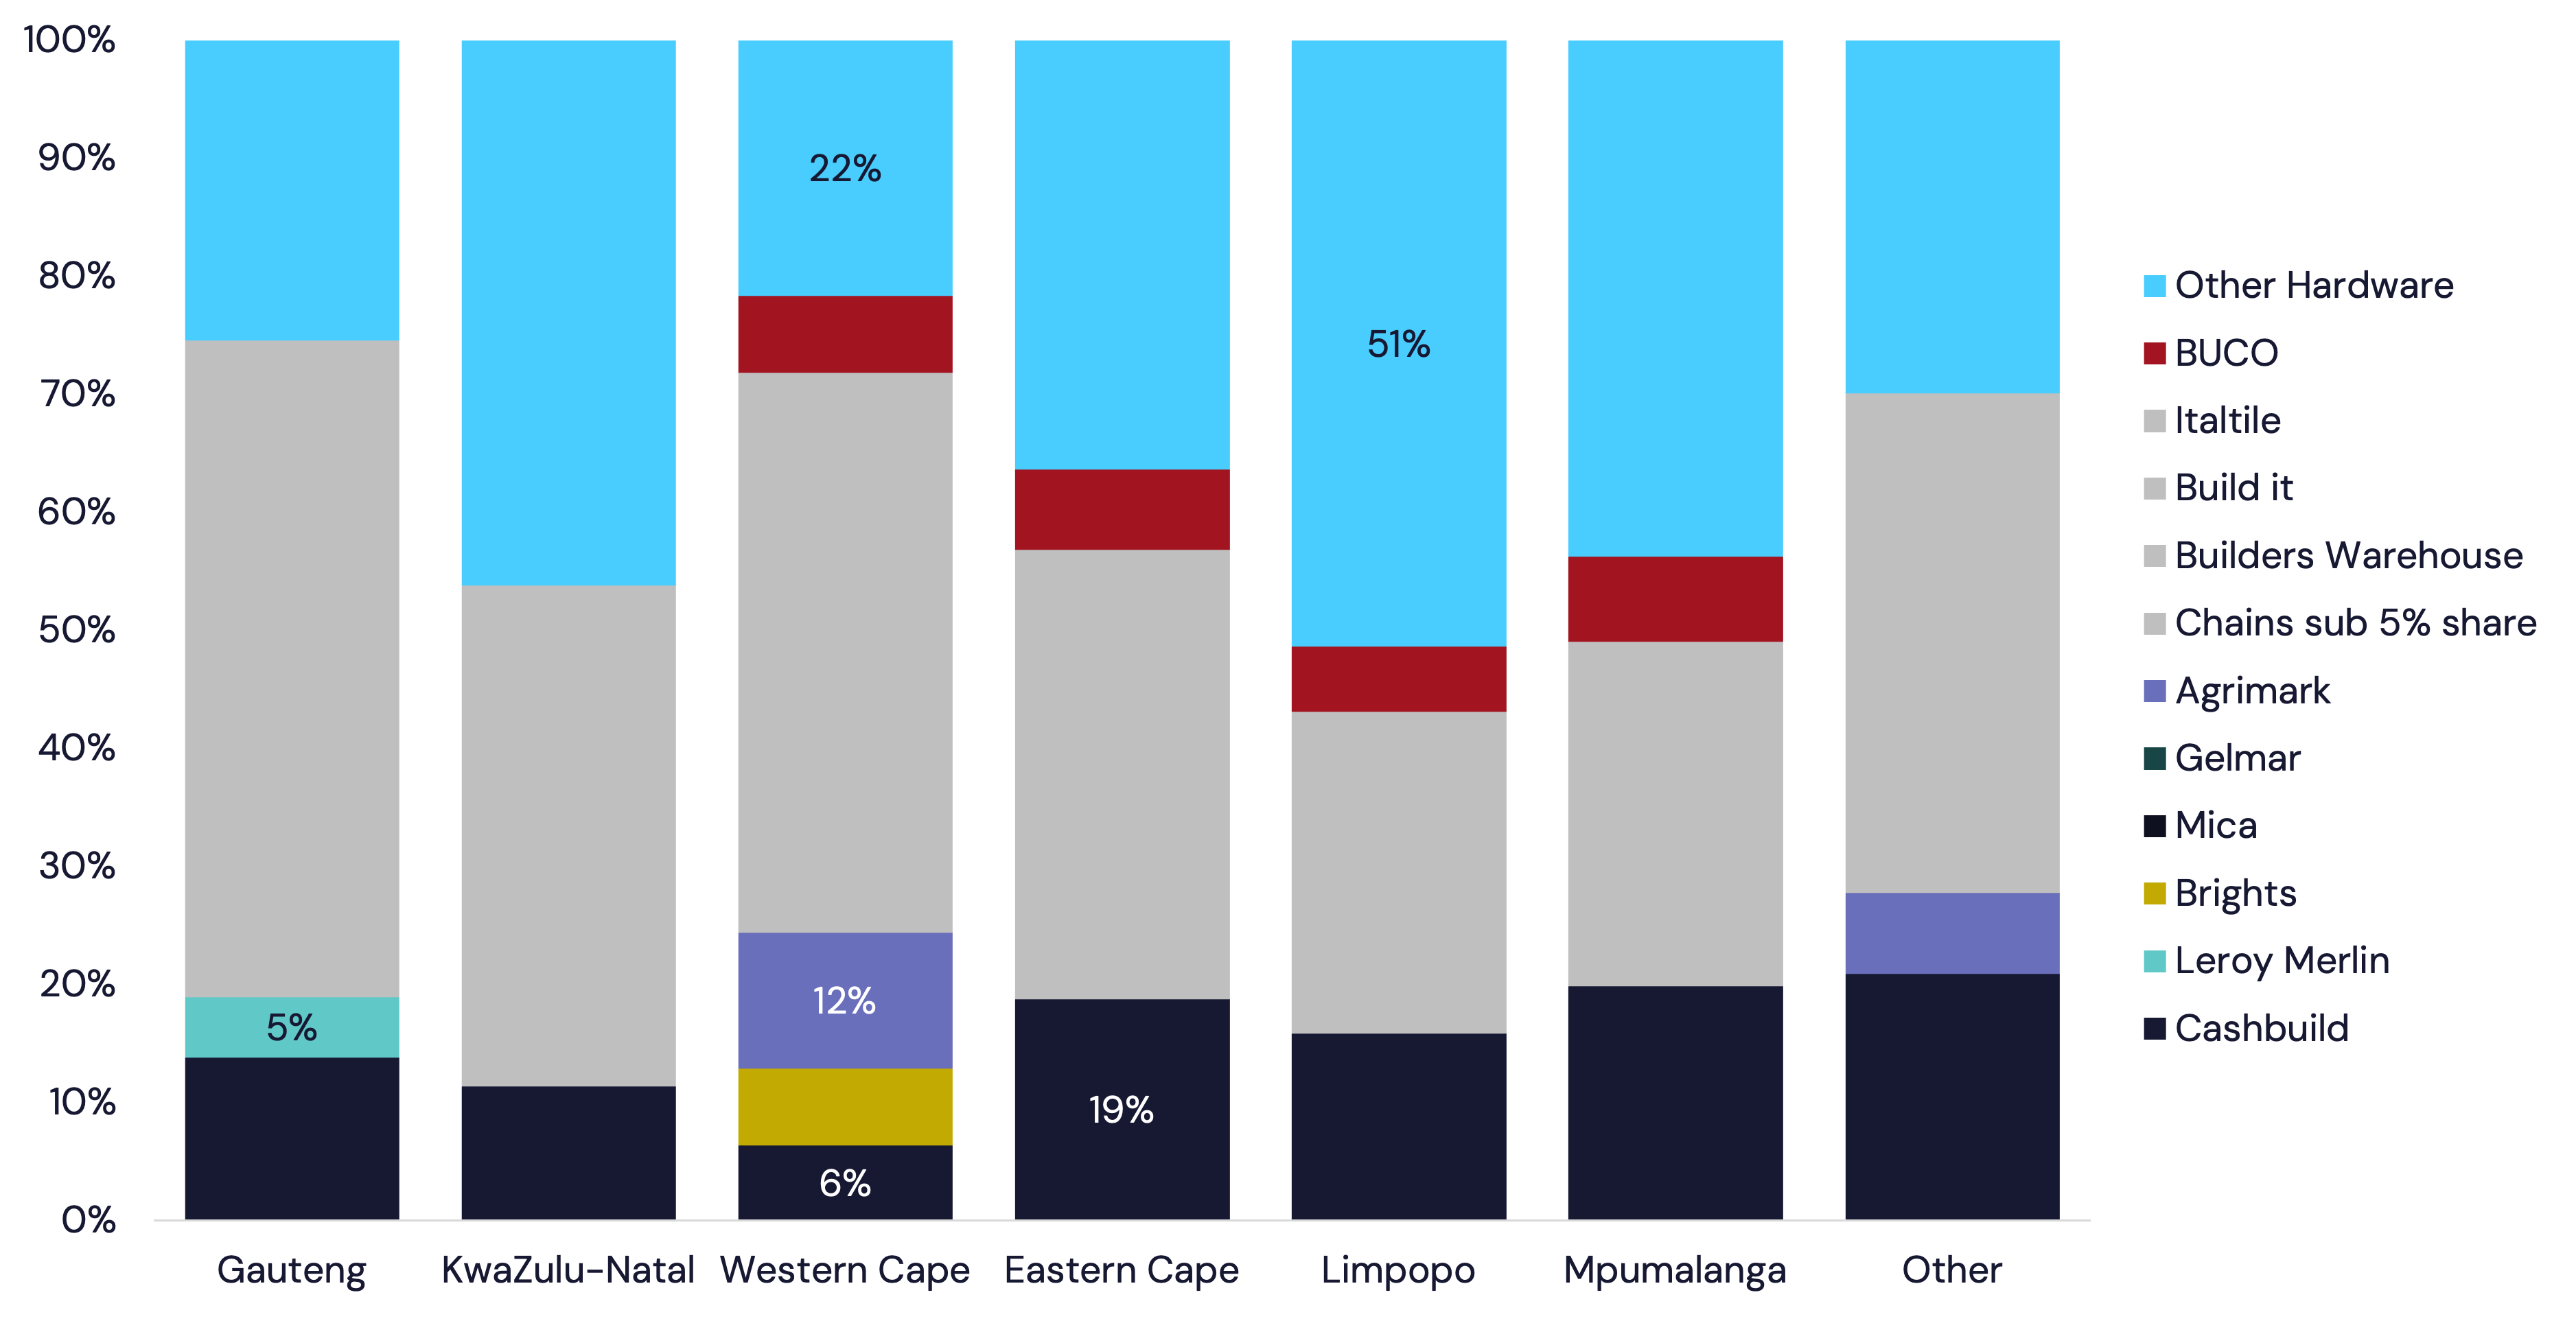
For example, Cashbuild’s market share is highest in the Eastern Cape and lowest in the Western Cape. Builders Warehouse is the largest retailer in Gauteng, but under-indexes in neighbouring Limpopo and Mpumalanga. Leroy Merlin is only present in Gauteng, and Agrimark would be foreign to visitors from the northern provinces, despite accounting for the third-largest spending share in the Western Cape.
The second observation is that the category is relatively fragmented. Our catch-all ‘Other Hardware’ grouping bundles any remaining hardware-related spend, and it accounts for ~35% of spending across the country. In KZN, Limpopo and Mpumalanga, that figure is even higher – more than 44% of spending. Maybe an opportunity for an ambitious consolidator?
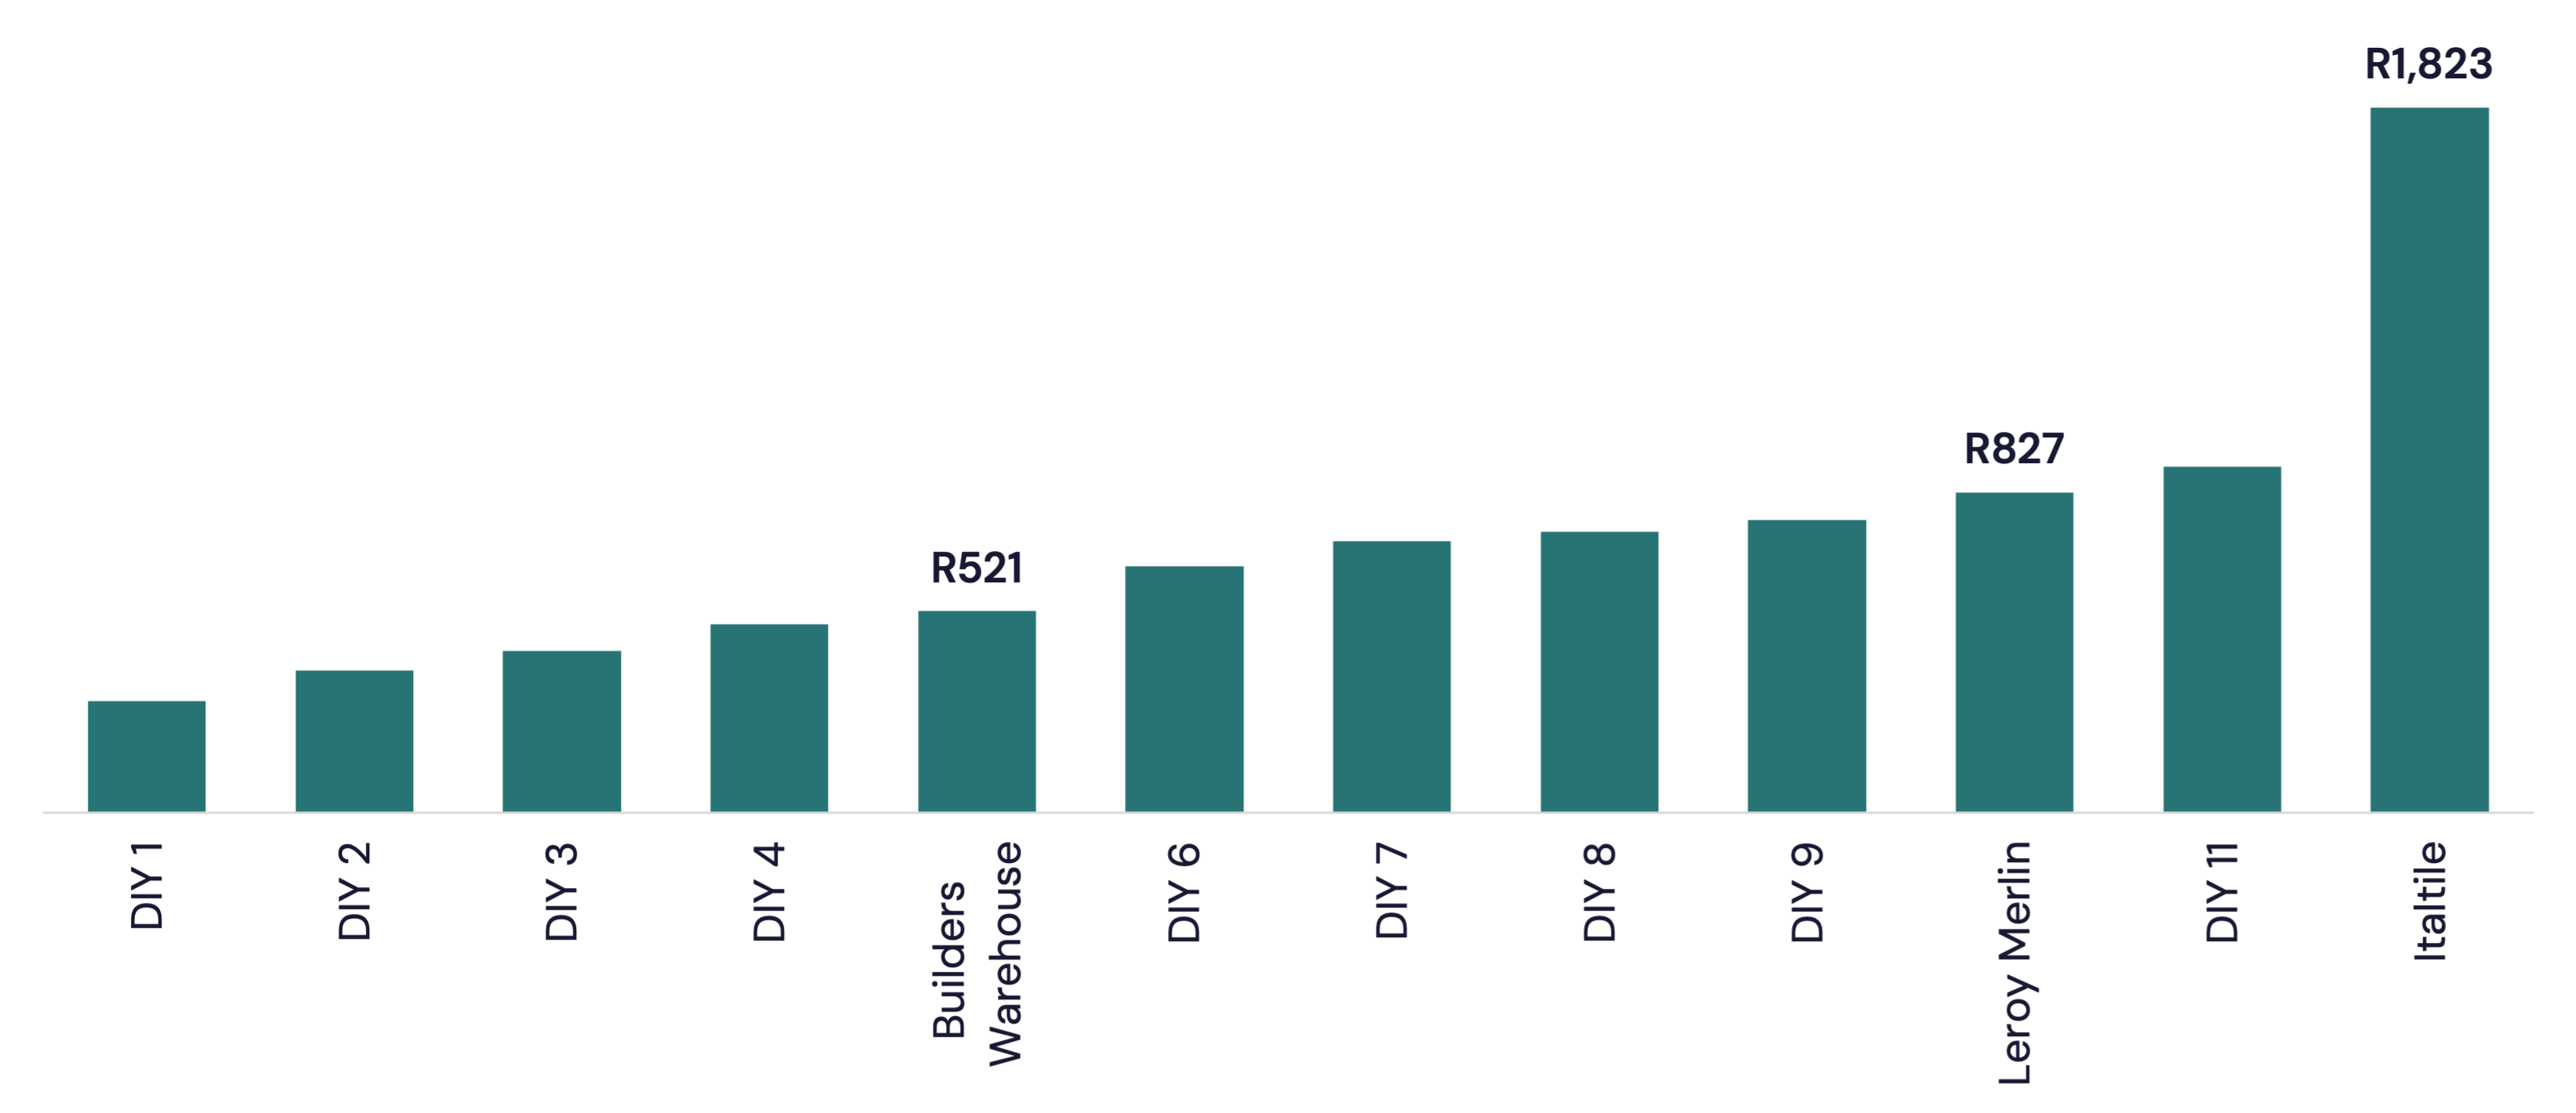
The final observation is the variation in transaction values across retailers. We can understand why buying expensive sanitary ware and tiles from Italtile would position it at the top of the list, but we’re surprised that Leroy Merlin’s ATV is ~58% higher than Builders Warehouse’s. (And we’re astounded that the average Builders Warehouse customer can leave the store after having spent only R521, a feat we’ve personally never managed to achieve…)
DIY & Hardware: Average transaction values
Thanks for reading. To access the full version of Currents, or any of our other premium client products, contact us and subscribe.