
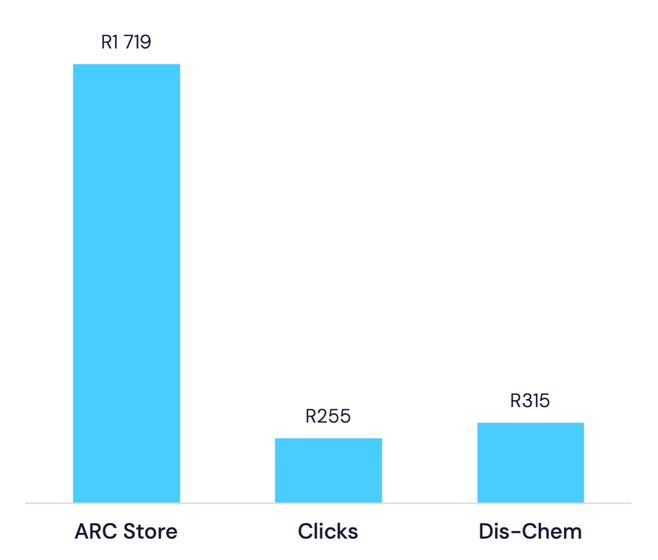
This week, Clicks announced that it paid R507m for another 35% of ARC Store, taking its total shareholding to 61%, and implying a valuation of the 12-store retailer at R1.4bn. Clicks describes ARC as a ‘specialist premium beauty retailer’, and that premium is reflected in the price…
It’s also reflected in the ATV in our 1Q26 data: the average customer pays R1,720 before stepping out of one of those 12 stores, which are located in major malls across South Africa.
In comparison, Clicks is about as mass-market as a retailer can get. Our data shows that the chain attracted more individual customers in 1Q26 than Dis-Chem and Woolworths combined, and the average customer leaves a Clicks store after parting with R255.
In our June report – In Plain Sight – we showed that Clicks is relatively underrepresented among higher-income, older customers: a demographic where Dis-Chem is over-indexed. We showed how attracting spend in this demographic would be an achievable growth option for Clicks, considering the chain’s already high share of category spend in the lower-income groups.
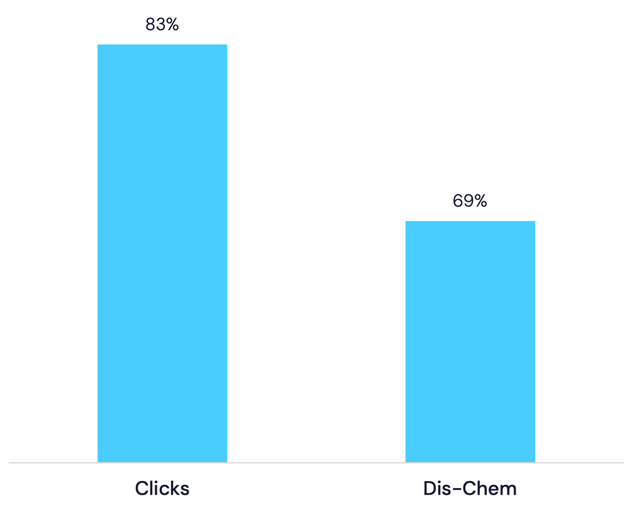
At the margin, Clicks’ acquisition of ARC Store will align with aspirational and upwardly-mobile Clicks customers. Indeed, our data shows that Clicks customers are more likely to shop at ARC than Dis-Chem customers.
ATV
Likelihood that an ARC customer also shops at:
Common threats
What do Spar and Truworths have in common?
Well, they’re both Top 5 retailers in categories where 9%+ of spend has shifted online in a short space of time, and they’ve both hardly participated in that shift. In the Apparel category, the disruptor has been Shein (now 9% of trackable spending) and in the Grocery category it’s Sixty60 (~8% of trackable spending).
Even more intriguing in the Apparel sector is that despite the shift to online, each of the retail groups continues to increase net space. In other words, five years ago, R100 of apparel sales was channelled through stores, whereas today only R91 of spend is channelled through stores – yet the aggregate store estate continues to expand. This doesn’t seem like a recipe for positive operating leverage… Only TFG recently changed tack, indicating the closure of ~200 stores.
We’ve spent a lot of time matching transactions to individual stores and soon we’ll reveal more granular insights about the relative performance of the various retailers’ store portfolios. Until then, let’s take stock of what exists.
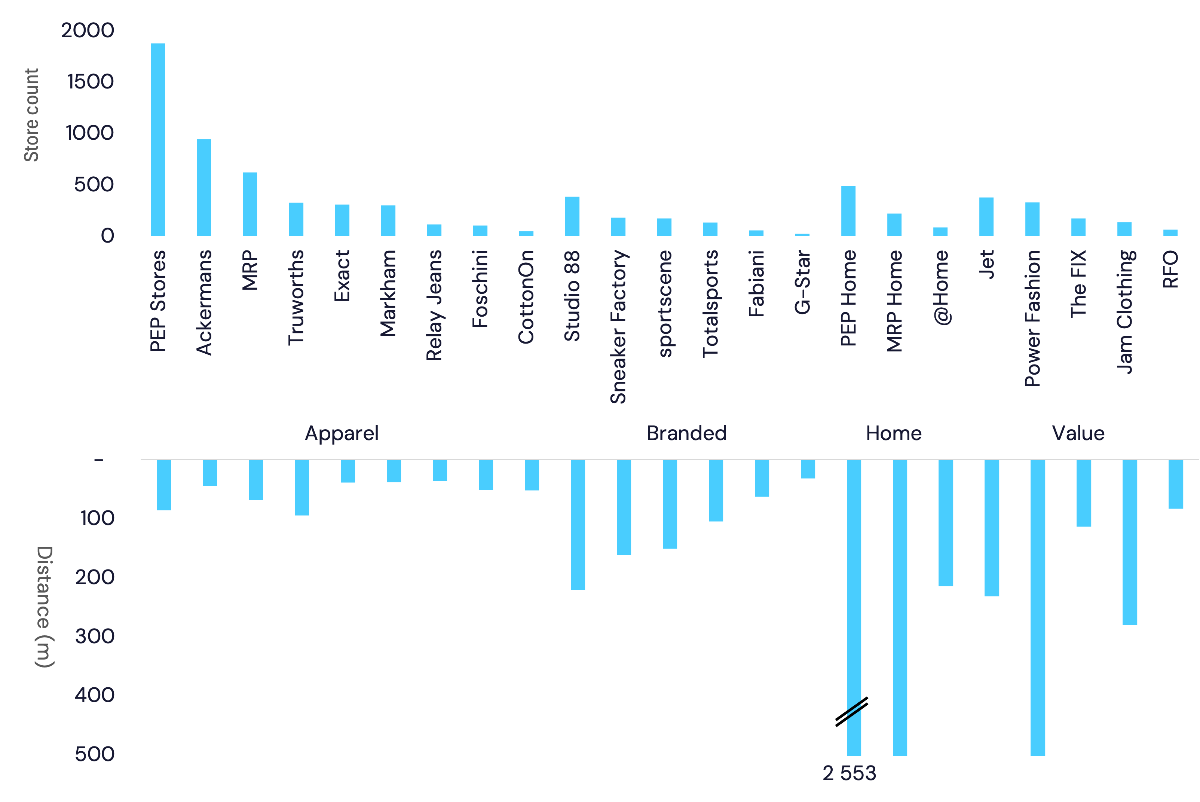
In the analysis below, we identified more than 7,000 stores from the four listed apparel retailers (Mr Price, TFG, Pepkor and Truworths) and a small number of independents. Overall, this is a large under-estimate because our count doesn’t consider co-located stores – a MRP Sport next to the standard MRP store, for example.
The top panel below shows the count by store – we’ve grouped stores into a few high-level categories (Apparel, Home, Value etc.) for easier comparison. PEP is by far the largest, with 1,875 clothing stores in our data set, and another 488 PEP Home locations.
Below that panel, we show the median distance for each store to the closest competitor in the same category. In general, a customer needs to travel less than 100m between competing stores in the mainstream Apparel category, whereas someone shopping for name-brand gear at Studio 88 must travel 200m to the nearest alternative.
Traveling distances between stores in the Home category is the highest, mostly because many PEP Home stores are in far-flung locations.
Store count and distance to nearest competitor (metres; axis is inverted)
Positive trends for PnP ASAP
PnP’s online channel, ASAP, has been a positive contributor to the PnP-branded business in South Africa over the past few reporting periods. And, although we still estimate ASAP to be much smaller than Sixty60, there are positive trends emerging.
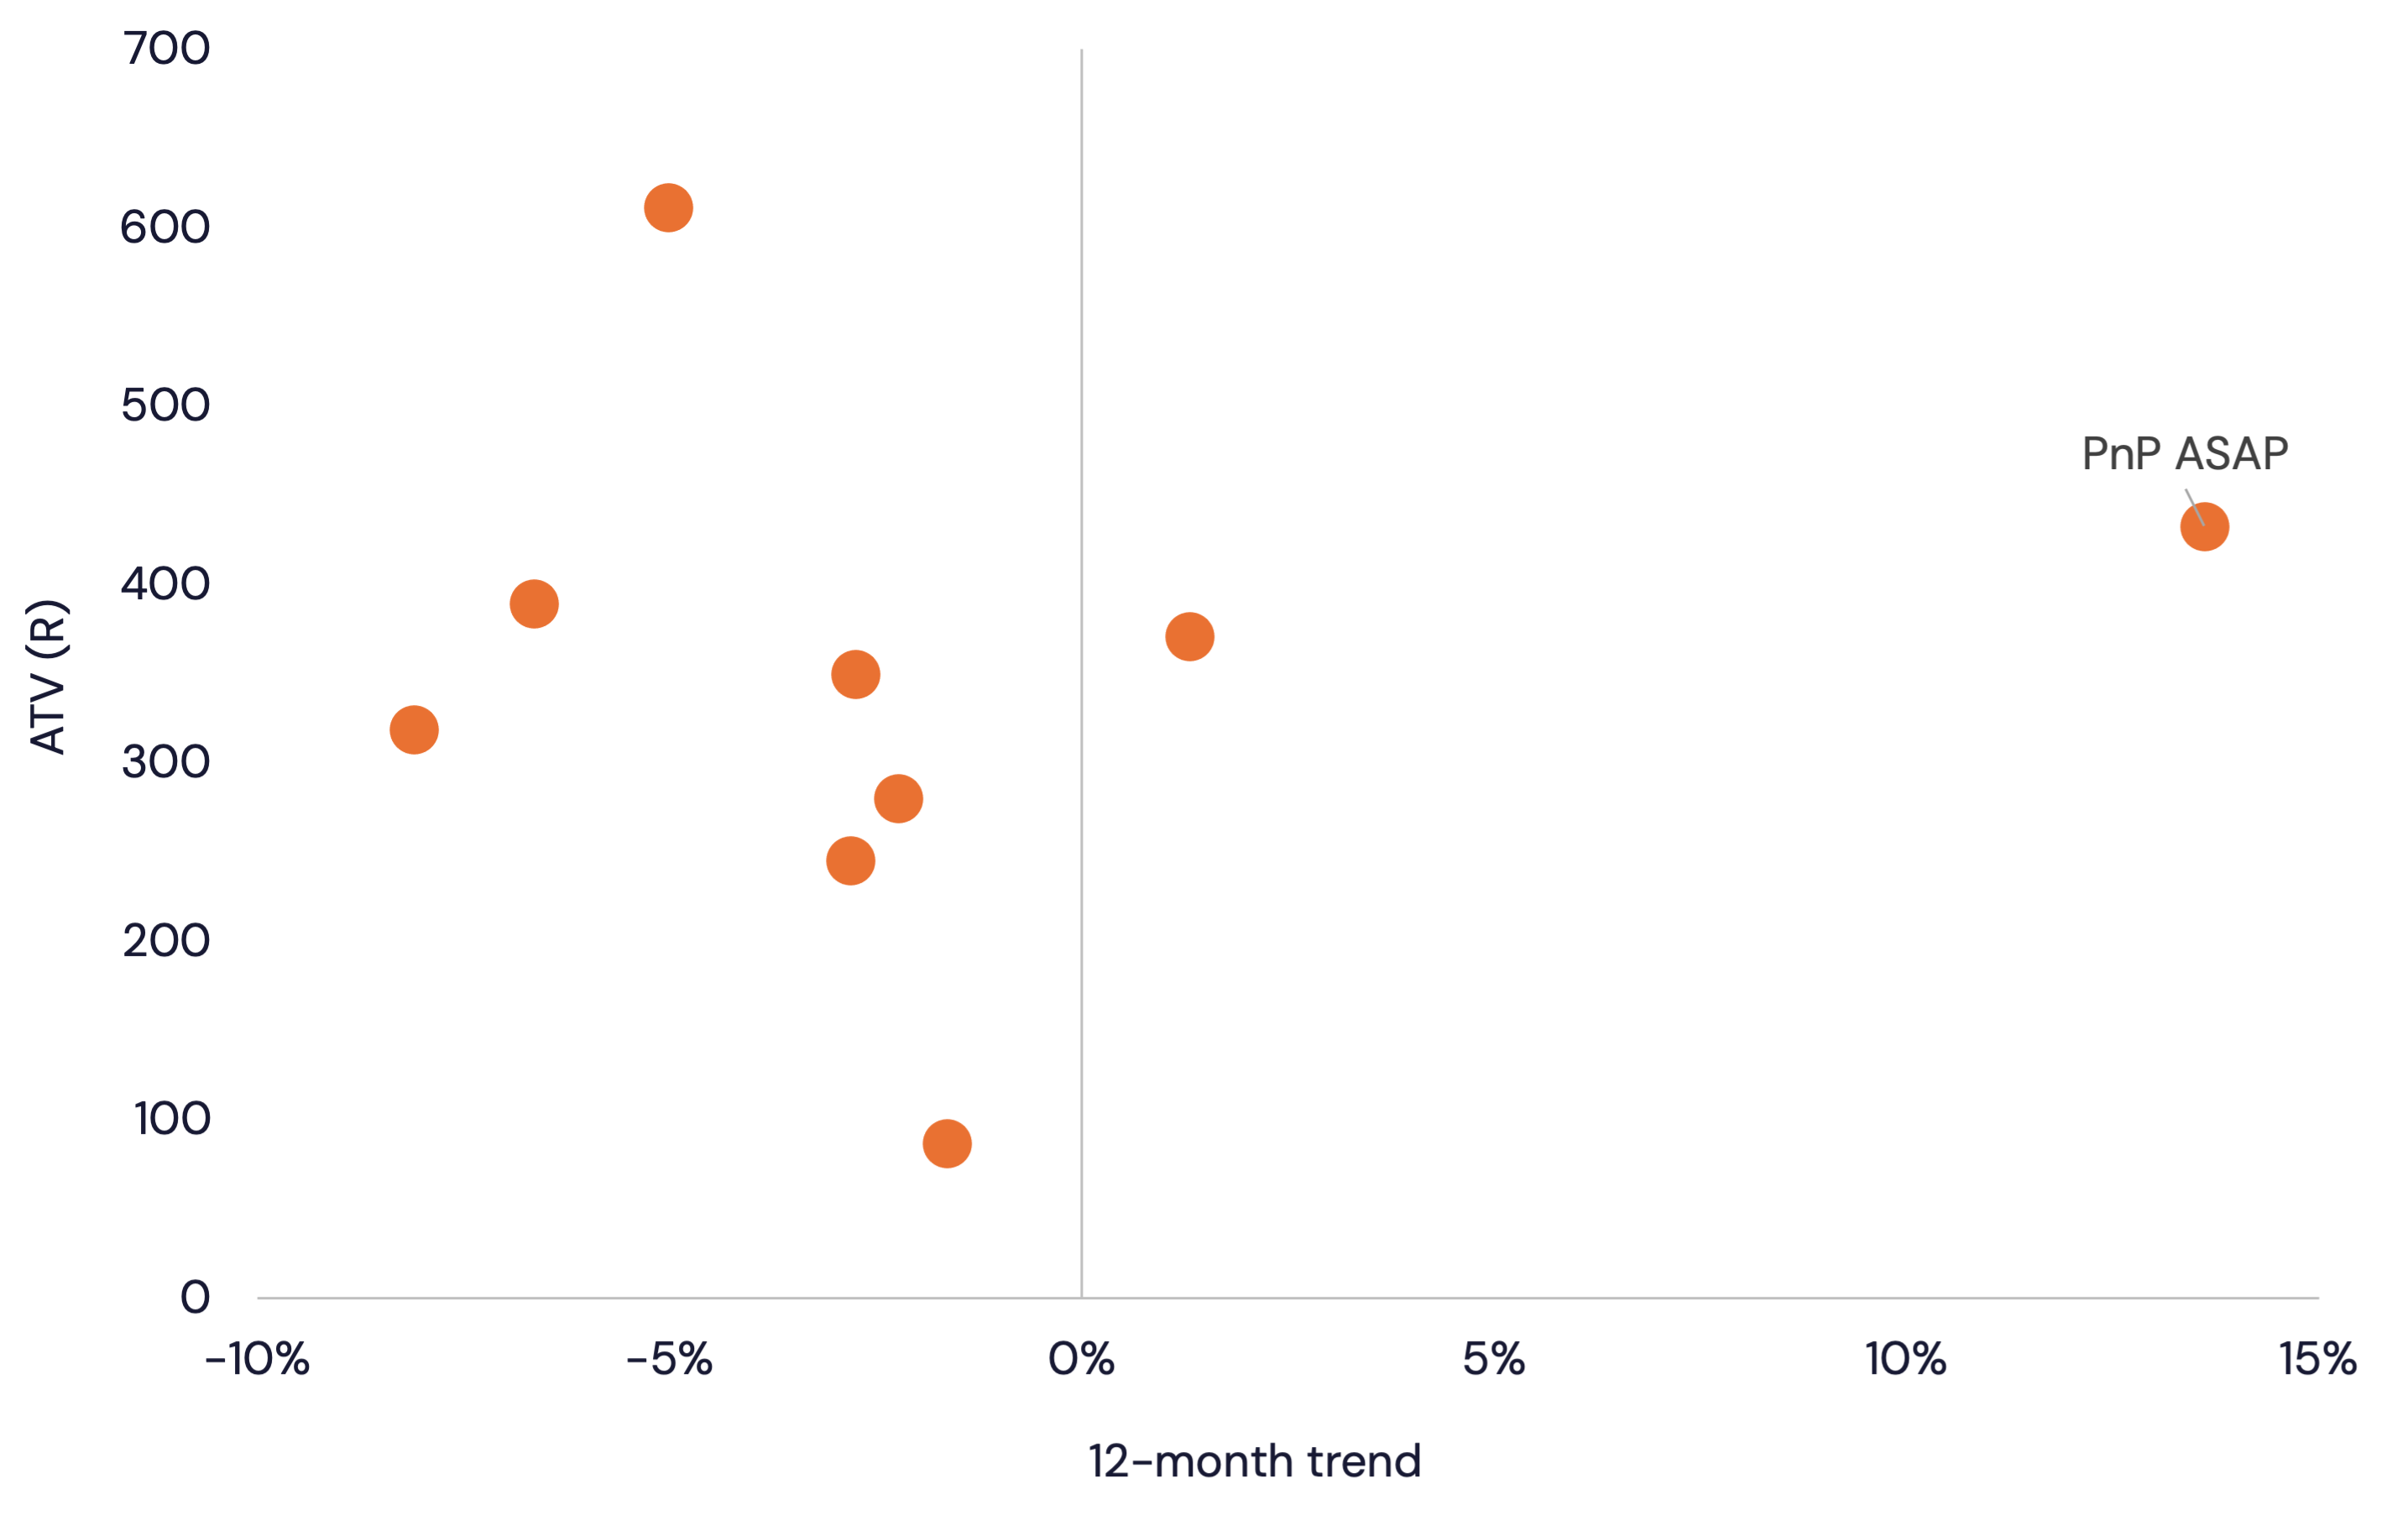
Average Transaction Value (ATV) is an important driver of growth, but we’ve noted declining ATV during 2026 as a headwind for most grocery retailers. PnP’s ASAP business appears to be a rare exception to this trend. In the next chart, we show ATVs for various grocery retailers, including online and in-store channels where relevant. The absolute ATV is shown on the vertical axis, and the 12-month trend is shown on the horizontal. Positive trends imply increasing ATVs.
In our data, ASAP’s ATV is ~R430 and growth has been strongly positive.
Change in Average Transaction Value: Grocery retailers
Market share movement
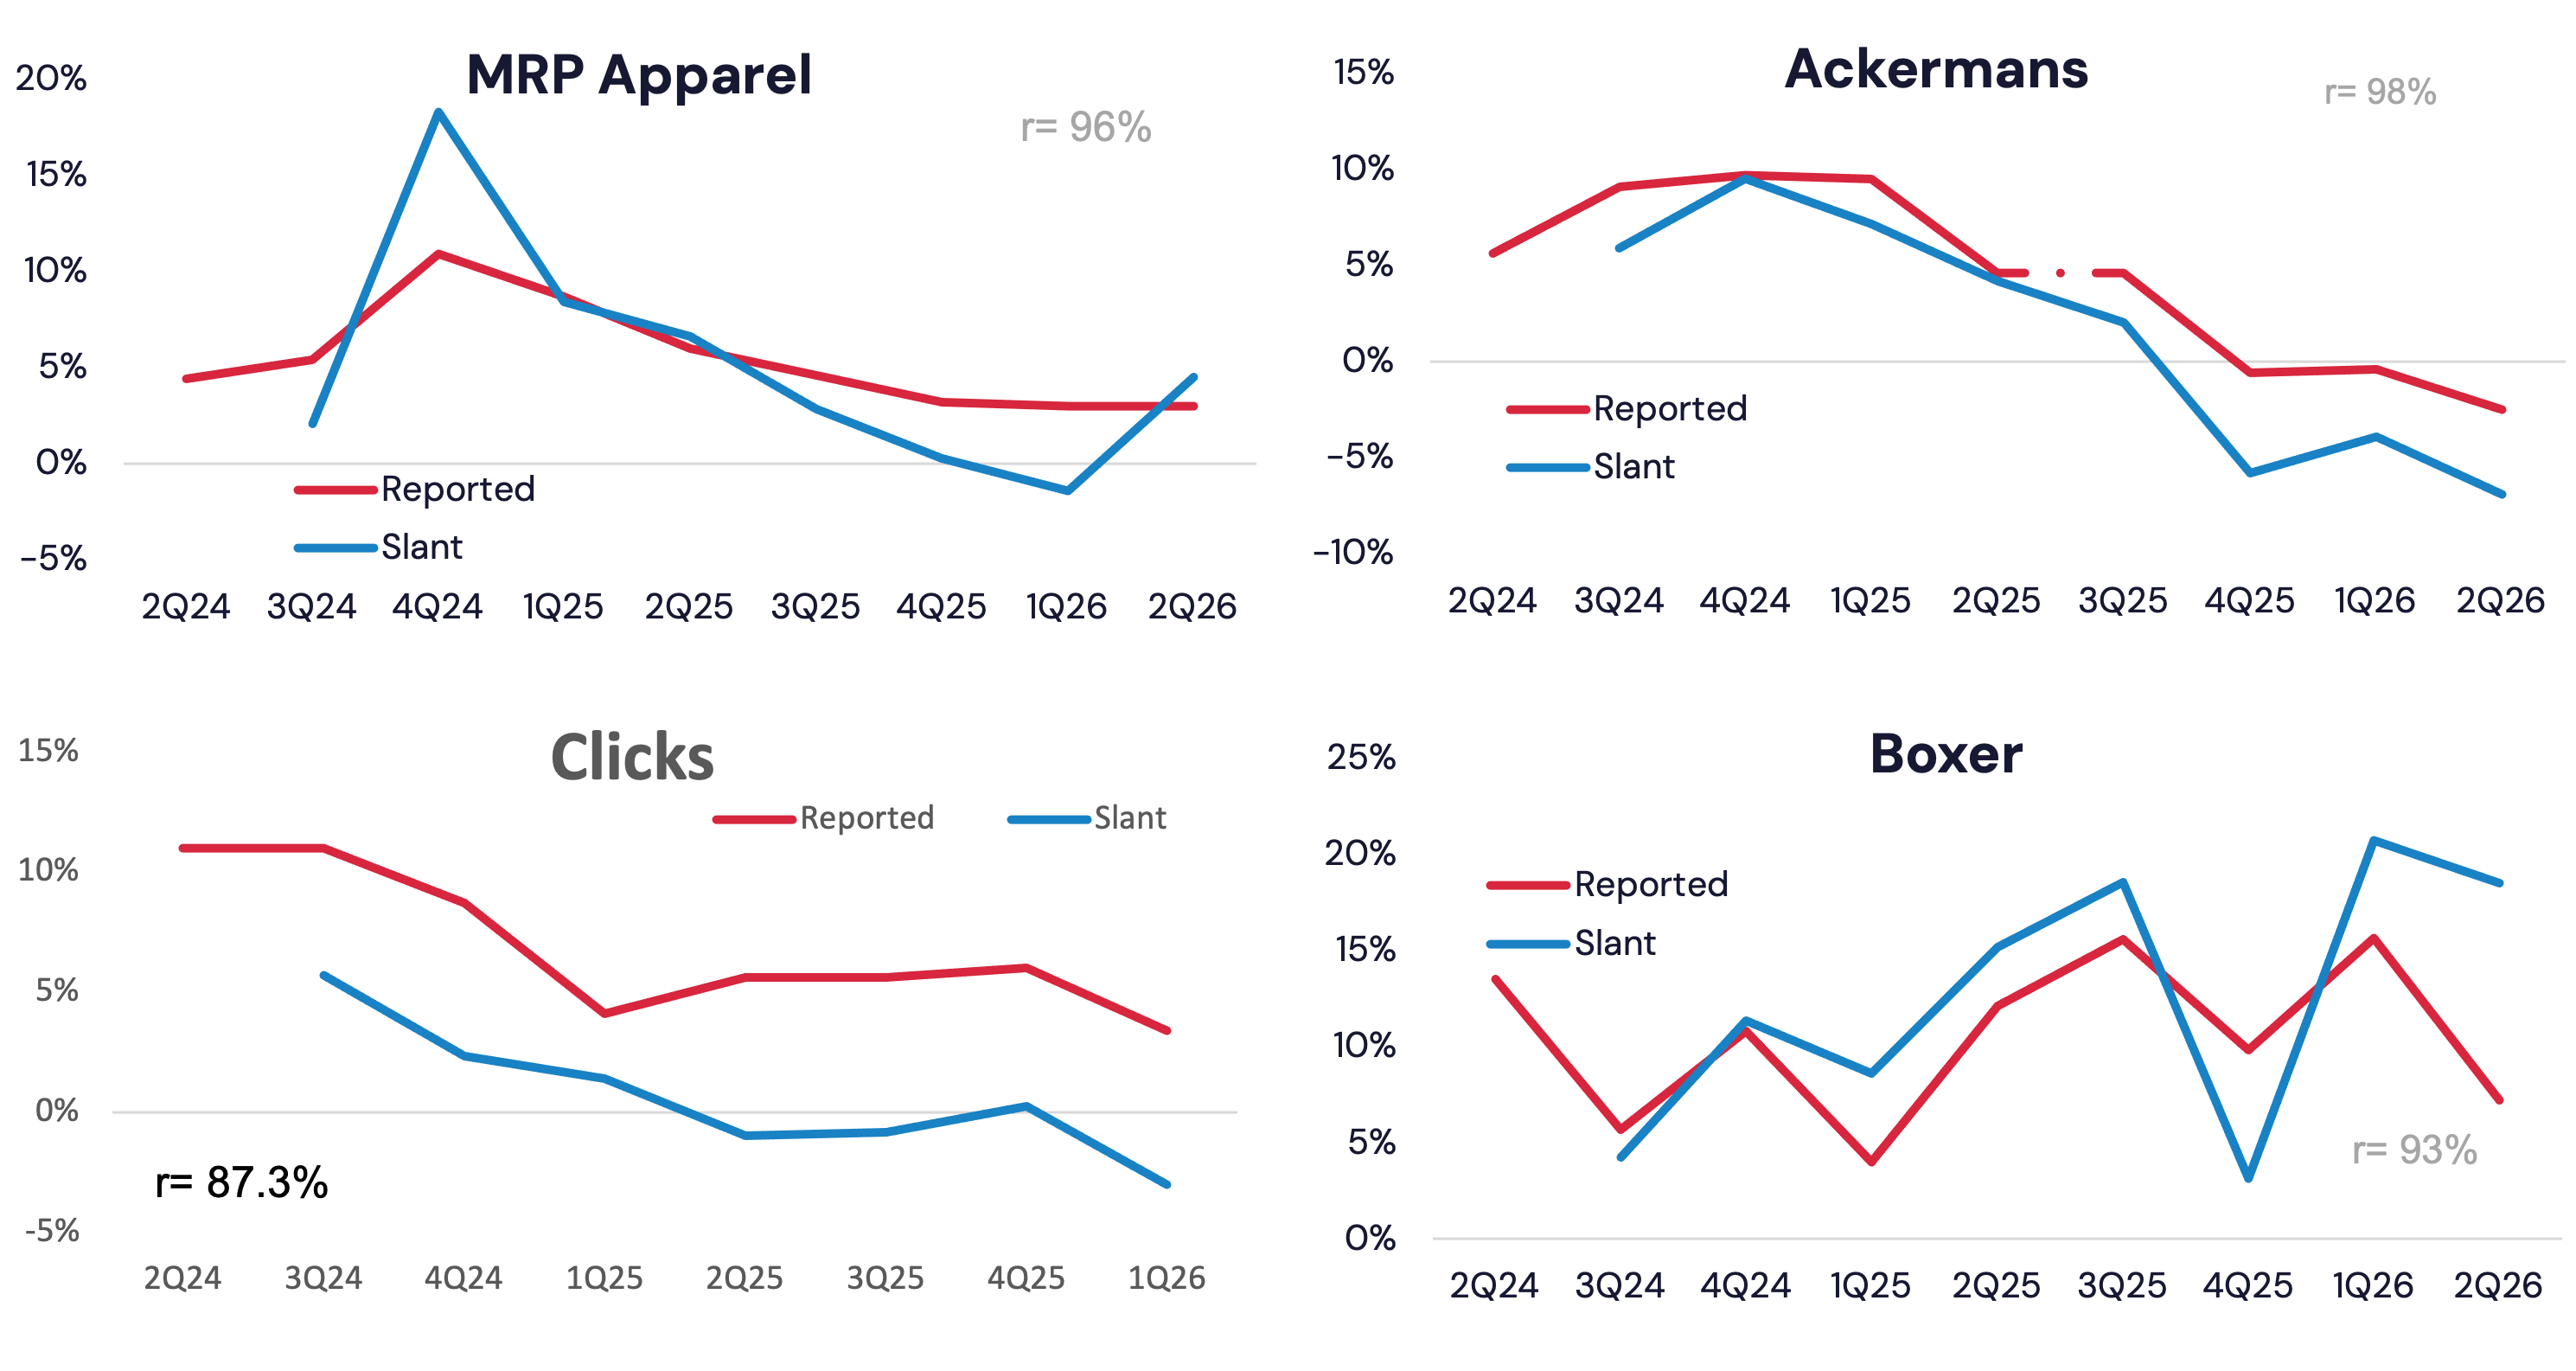
We have now accumulated three years’ worth of spending data, and the chart below provides examples of the strong correlation between Slant’s growth estimates and retailers’ reported sales growth.
The latest trends are reserved for subscribers. If knowing more about the recent performance of your investments, or your competitors, could be helpful to your decisions, please get in touch.
Correlation between Slant and reported sales growth